Chart USD/ZAR Update: Consolidating - potential for a test above 18.5000

Little change, as mixed intraday studies keep near-term sentiment cautious
| Level | Comment | Level | Comment | |||||
|---|---|---|---|---|---|---|---|---|
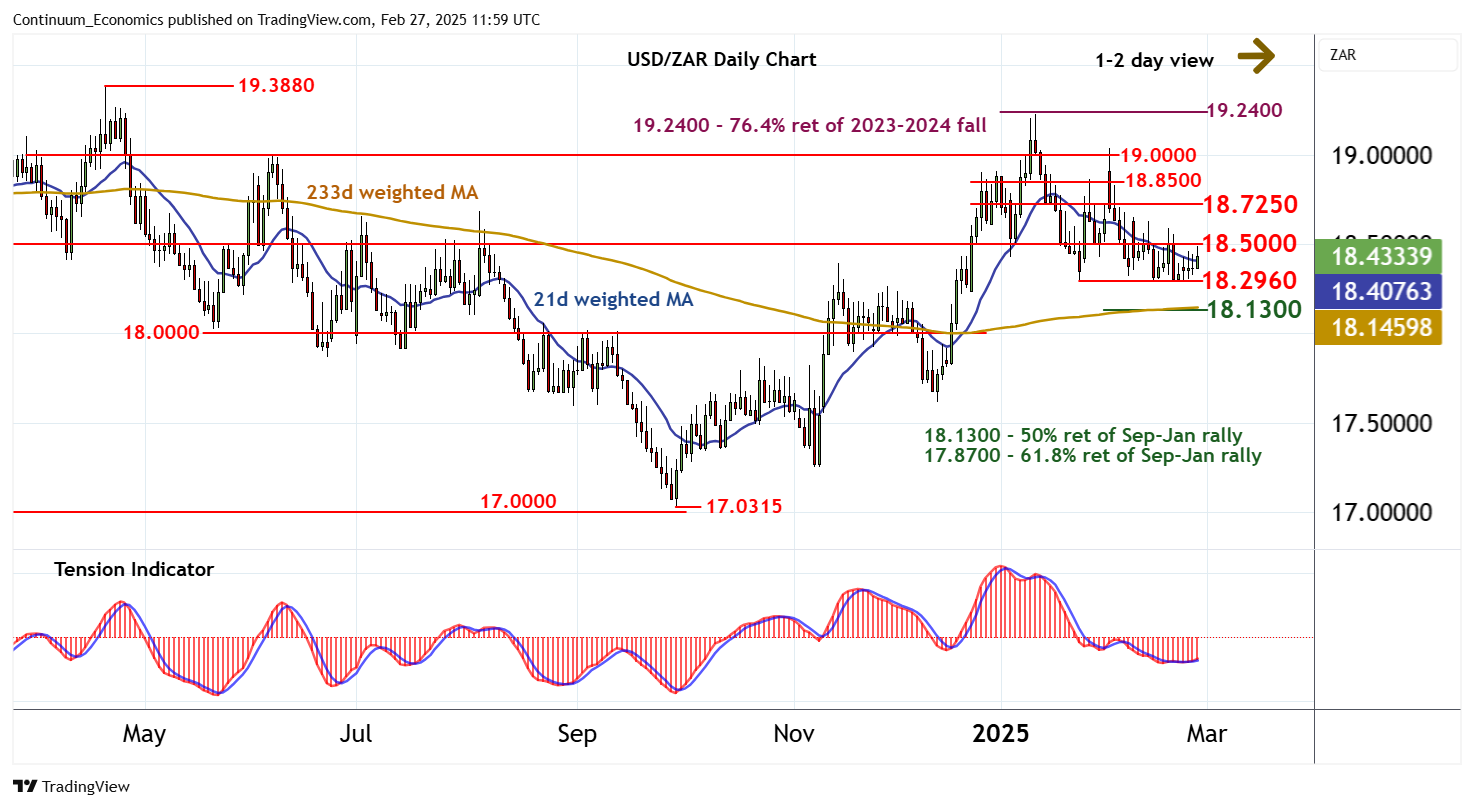
| R4 | 19.0000 | ** | congestion | S1 | 18.2960 | * | 24 Jan YTD low | |
| R3 | 18.8500 | break level | S2 | 18.1300 | * | 50% ret of Sep-Jan rally | ||
| R2 | 18.7250 | * | congestion | S3 | 18.0000 | ** | congestion | |
| R1 | 18.5000 | ** | break level | S4 | 17.8700 | ** | 61.8% ret of Sep-Jan rally |
Asterisk denotes strength of level
11:50 GMT - Little change, as mixed intraday studies keep near-term sentiment cautious and extend consolidation just above 18.4000. Daily readings are showing signs of improvement, suggesting room for a retest of resistance at 18.5000. But bearish weekly charts are expected to limit any break above here in renewed selling interest towards congestion resistance at 18.7250. Following cautious trade, fresh losses are looked for. A break below support at the 18.2960 current year low of 24 January will turn sentiment negative and extend January losses towards the 18.1300 Fibonacci retracement. But by-then oversold daily studies could prompt renewed short-covering/consolidation.