Published: 2025-07-30T05:36:34.000Z
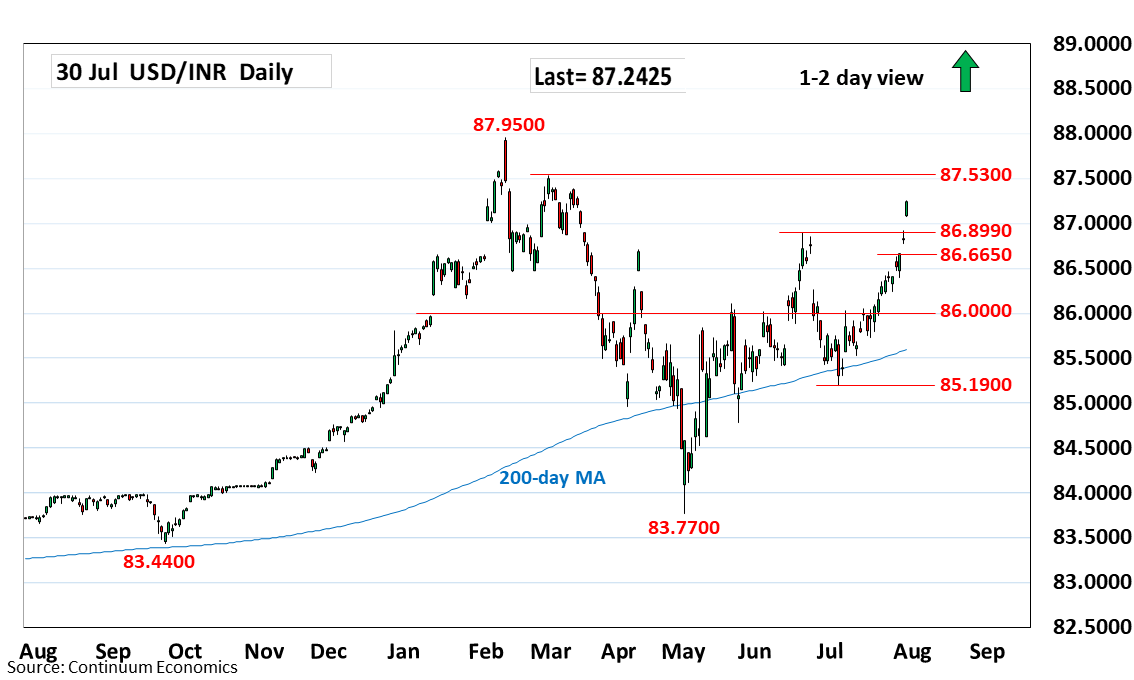
Chart USD/INR Update: Shaply higher above 87.0000

Technical Analyst
-
Extending sharp bounce from the 86.5000 level with bullish momentum driving prices sharply higher above the 87.0000
| Level | Comment | Level | Comment | |||||
|---|---|---|---|---|---|---|---|---|
| R4 | 88.0000 | * | figure | S1 | 86.8990 | * | Jun high | |
| R3 | 87.9500 | ** | 10 Feb all-time high | S2 | 86.6650 | * | 28 Jul high, gap | |
| R2 | 87.5300 | * | 28 Feb high | S3 | 86.4000 | * | 28 Jul low | |
| R1 | 87.3850 | * | 11 Mar high | S4 | 86.2400 | * | 24 Jul low |
Asterisk denotes strength of level
05:30 GMT - Extending sharp bounce from the 86.5000 level with bullish momentum driving prices sharply higher above the 87.0000 level. Focus now turn to the 87.3800 and 87.5300, 11 March and 28 February highs. Beyond this will expose the February all-time high at 87.9500 to retest. Deep overbought daily studies caution corrective pullback with support raised to the June high at 86.8990 expected to underpin. Break here is needed to ease the upside pressure and see room for deeper pullback to 86.6650/86.5000 congestion.