Published: 2026-01-22T08:41:43.000Z
Chart EUR/USD Update: Leaning lower
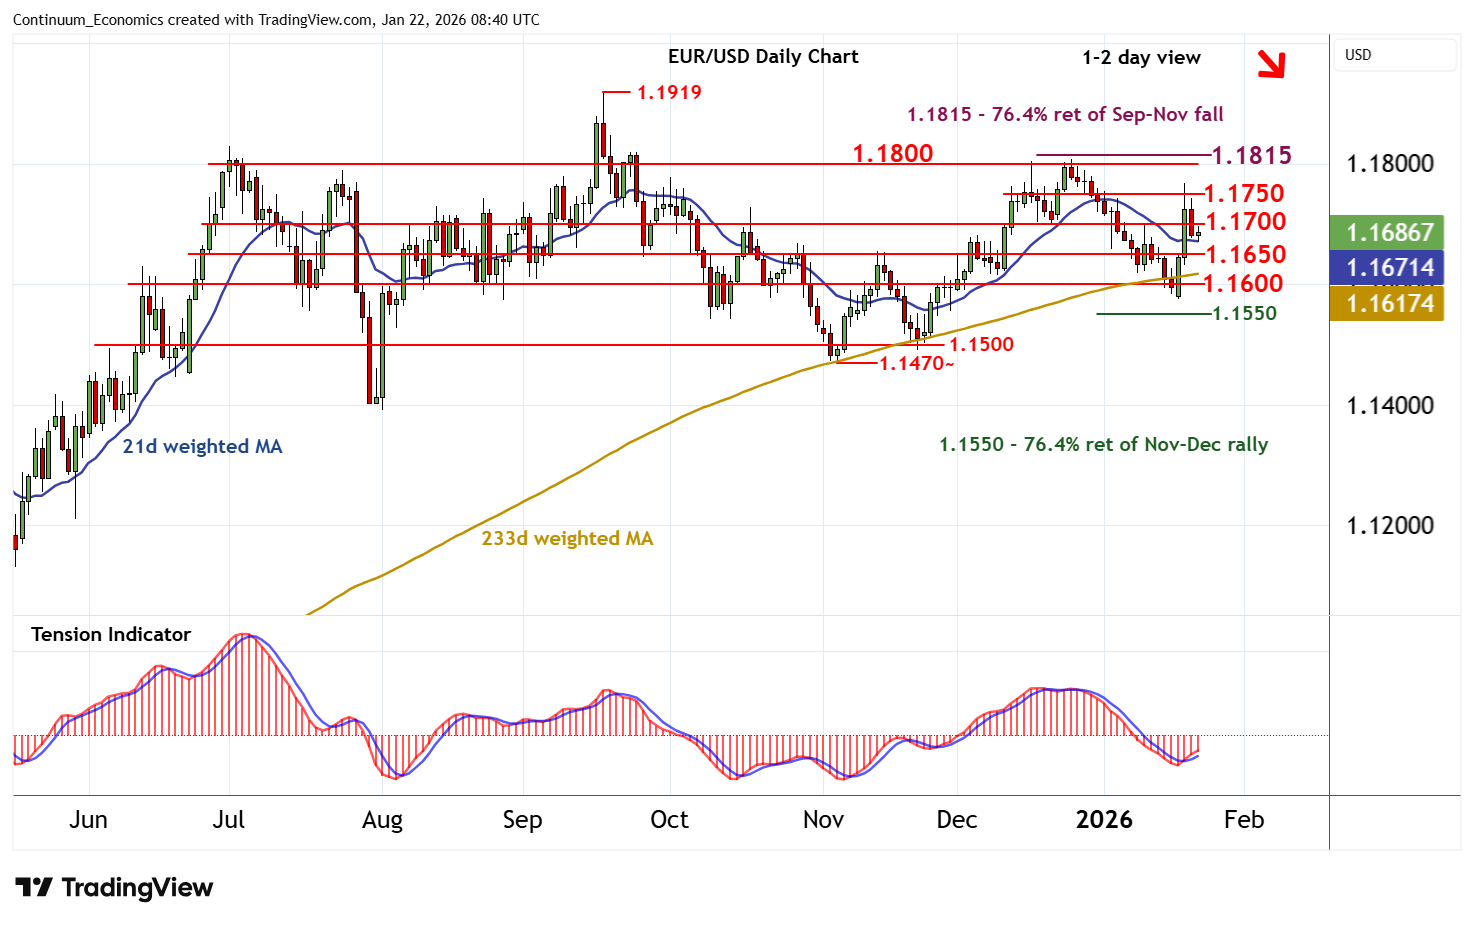
1
The anticipated break below 1.1700 has reached 1.1670
| Levels | Imp | Comment | Levels | Imp | Comment | |||
|---|---|---|---|---|---|---|---|---|
| R4 | 1.1800 | * | congestion | S1 | 1.1650 | * | congestion | |
| R3 | 1.1768 | spike high | S2 | 1.1600 | ** | congestion | ||
| R2 | 1.1750 | * | congestion | S3 | 1.1550 | ** | 76.4% ret of Nov-Dec rally | |
| R1 | 1.1700 | * | congestion | S4 | 1.1500 | ** | congestion |
*Asterisk denotes strength of level
08:30 GMT - The anticipated break below 1.1700 has reached 1.1670, before bouncing into consolidation around 1.1685. Intraday studies are mixed/negative, highlighting potential for continuation towards congestion support at 1.1650. But rising daily stochastics and the positive daily Tension Indicator should limit any initial tests in consolidation, before deteriorating daily readings prompt further losses. Meanwhile, resistance is lowered to congestion around 1.1700. A close above here, if seen, will help to stabilise price action and prompt consolidation beneath further congestion around 1.1750.