Published: 2026-02-24T06:29:43.000Z
Chart GBP/JPY Update: Consolidating above 208.10/207.50 support
1
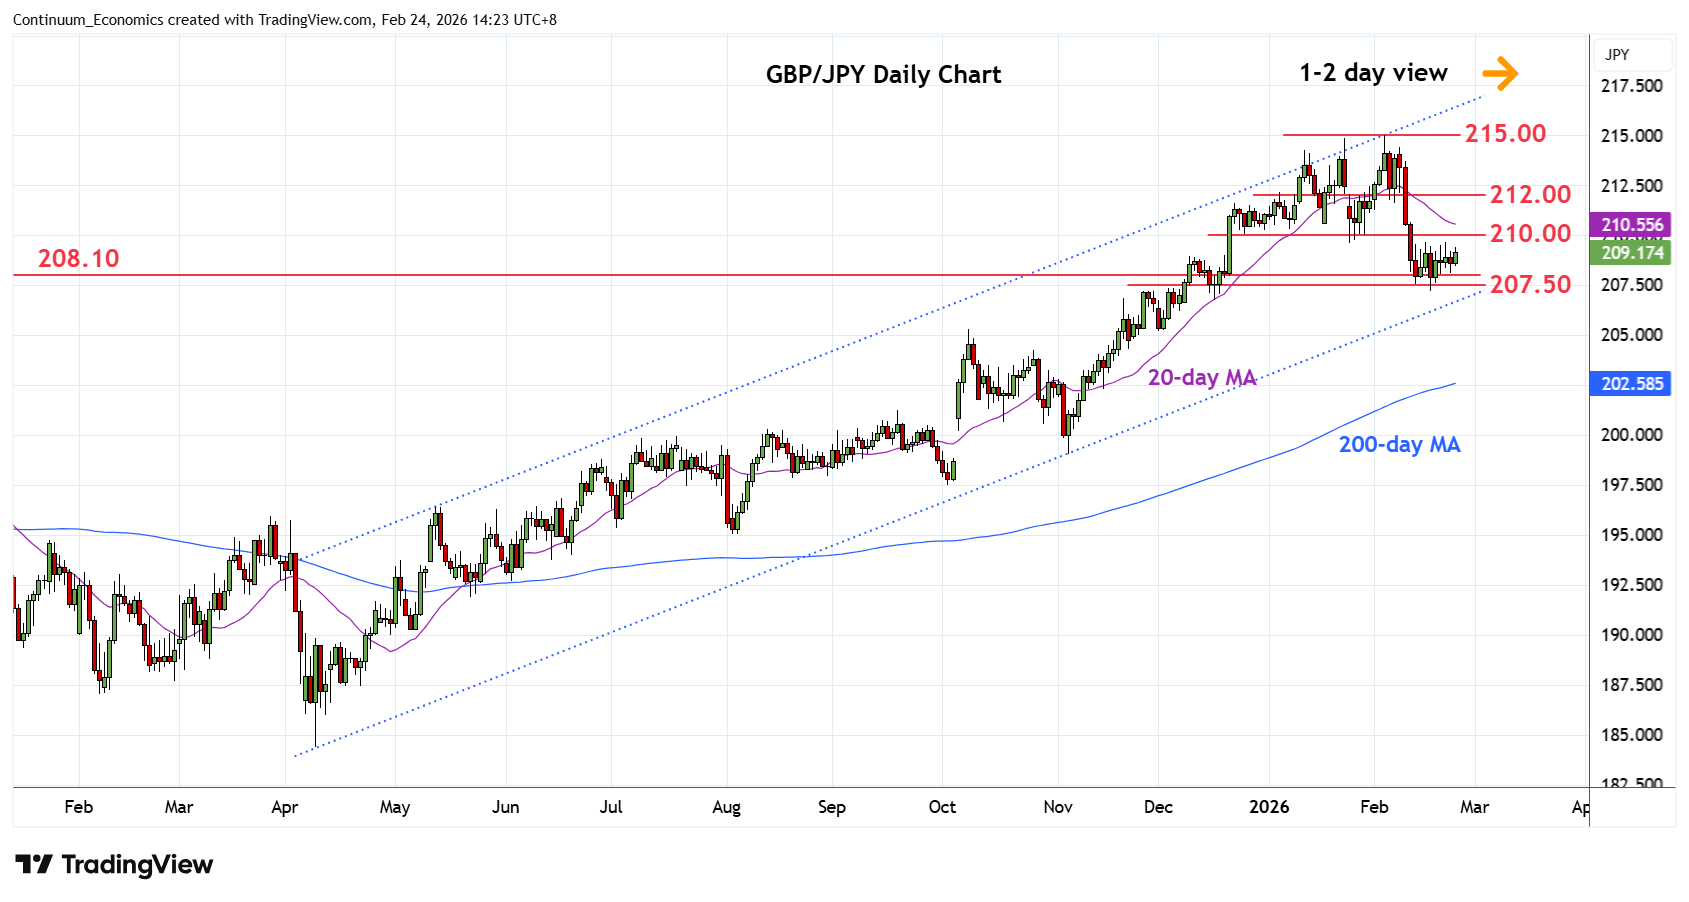
Little change, as prices extend consolidation above support at the 208.10/207.50 area
| Levels | Imp | Comment | Levels | Imp | Comment | |||
|---|---|---|---|---|---|---|---|---|
| R4 | 215.00 | ** | 4 Feb YTD high | S1 | 208.10 | * | 2024 year high | |
| R3 | 214.00/40 | * | congestion, 9 Feb high | S2 | 207.50 | * | congestion | |
| R2 | 212.00 | * | congestion | S3 | 206.00 | * | congestion | |
| R1 | 210.00 | * | congestion | S4 | 205.30/00 | * | Oct high, congestion |
Asterisk denotes strength of level
06:25 GMT - Little change, as prices extend consolidation above support at the 208.10/207.50 area. Consolidation here see prices tracing out a flag pattern and suggest this giving way to renewed selling pressure later. Break will open up room for see deeper pullback to retrace gains from the April 2025 year low and see room to support at the 206.00 congestion and 205.30/00 area. Meanwhile, resistance at the 210.00 level is expected to cap. Lift over this, if seen, will see room for stronger bounce to resistance at the 212.00 level.