Published: 2026-04-17T15:58:41.000Z
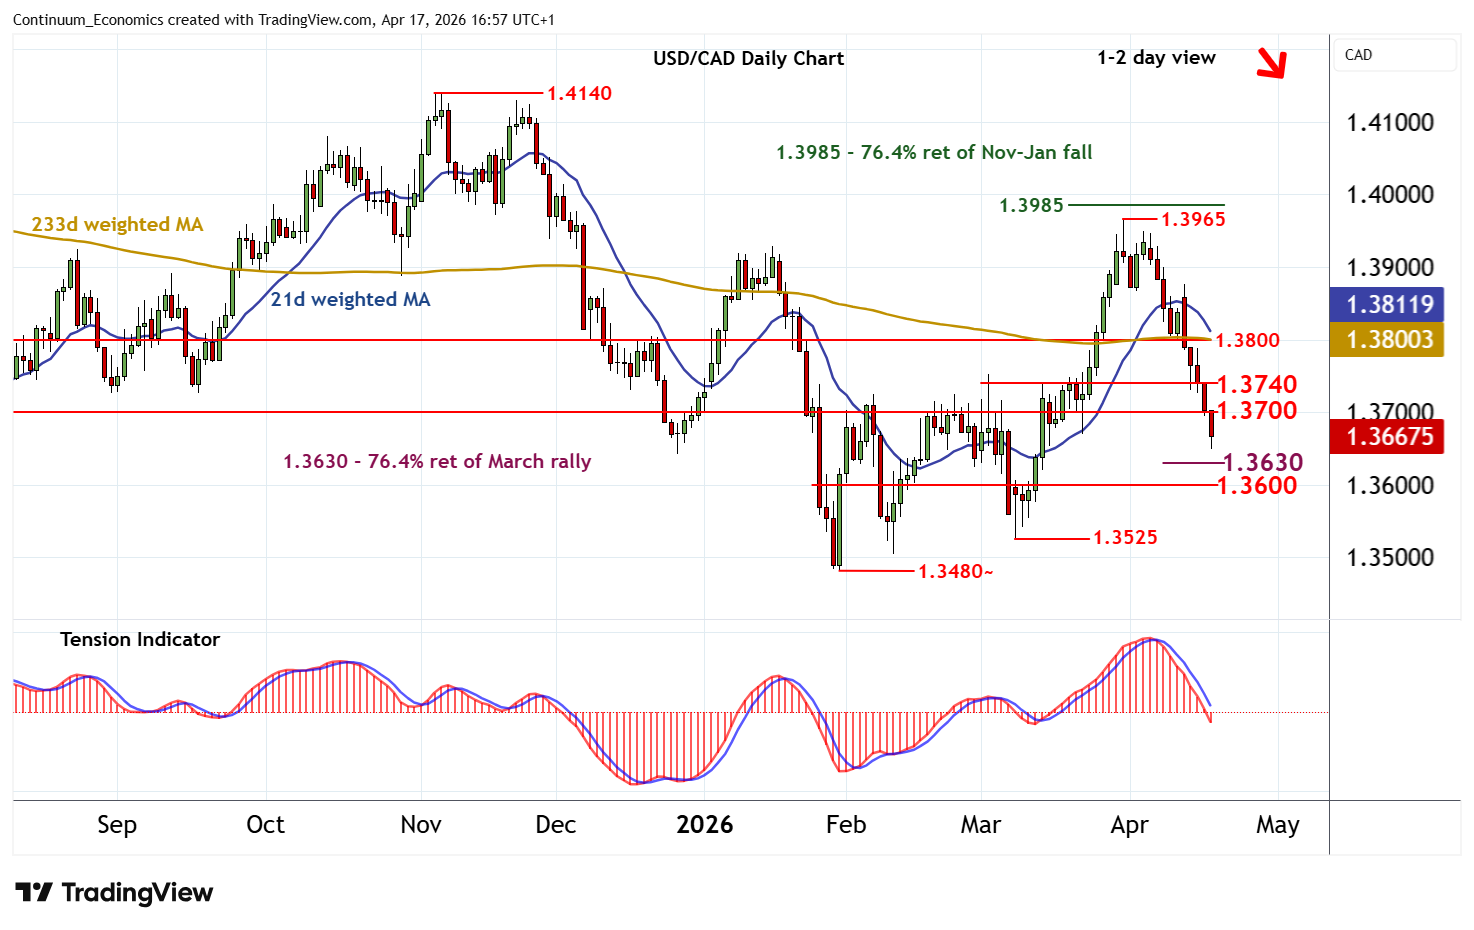
Chart USD/CAD Update: Strong support at the 1.3630 Fibonacci retracement
6
Anticipated losses have reached congestion around 1.3650
| Levels | Imp | Comment | Levels | Imp | Comment | |||
|---|---|---|---|---|---|---|---|---|
| R4 | 1.3850 | * | congestion | S1 | 1.3650 | * | congestion | |
| R3 | 1.3800 | * | congestion | S2 | 1.3630 | ** | 76.4% ret of March rally | |
| R2 | 1.3740 | * | break level | S3 | 1.3600 | ** | congestion | |
| R1 | 1.3700 | ** | congestion | S4 | 1.3525 | * | 9 Mar (m) low |
Asterisk denotes strength of level
16:35 BST - Anticipated losses have reached congestion around 1.3650, where flattening oversold intraday studies are prompting short-term reactions. Daily readings continue to track lower, however, highlighting room for a further break towards the 1.3630 Fibonacci retracement. However, flat oversold daily stochastics could limit any initial tests of here in short-covering/consolidation, before deteriorating weekly charts prompt still further losses. Meanwhile, resistance is lowered to congestion around 1.3700. A close above here, if seen, would help to stabilise price action and prompt consolidation beneath the 1.3740 break level.