Chart USD Index DXY Update: Extending losses
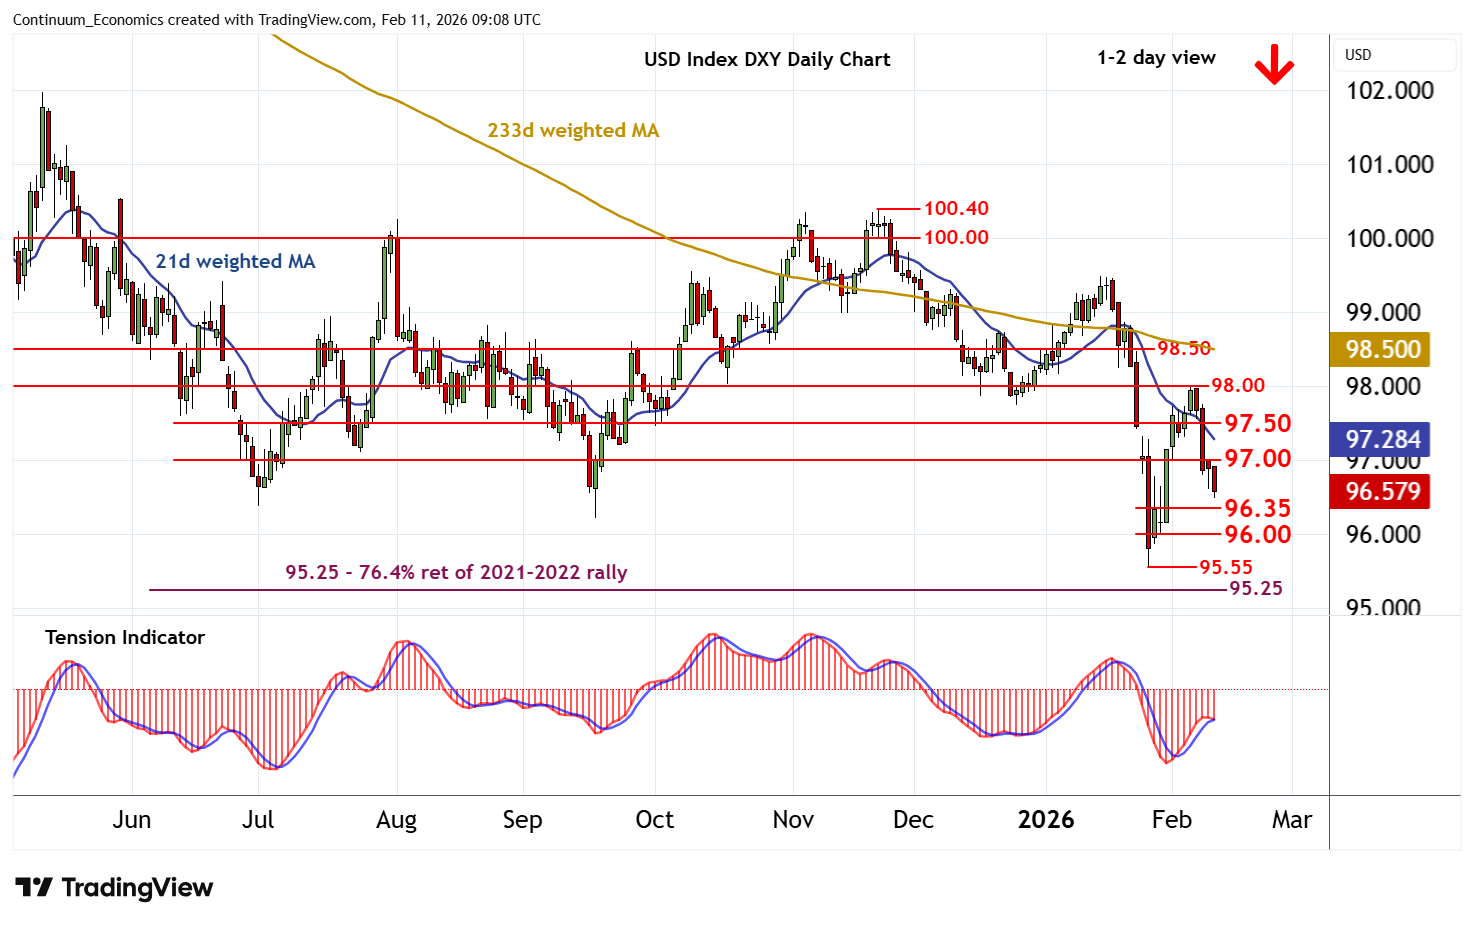
Consolidation beneath congestion resistance at 97.00 is giving way to a fresh break lower
| Levels | Imp | Comment | Levels | Imp | Comment | |||
|---|---|---|---|---|---|---|---|---|
| R4 | 98.50 | * | congestion | S1 | 96.35 | congestion | ||
| R3 | 98.00 | * | congestion | S2 | 96.00 | * | congestion | |
| R2 | 97.50 | ** | congestion | S3 | 95.55 | ** | 27 Jan YTD low | |
| R1 | 97.00 | * | congestion | S4 | 95.25 | ** | 76.4% ret of 2021-2022 rally |
Asterisk denotes strength of level
08:50 GMT - Consolidation beneath congestion resistance at 97.00 is giving way to a fresh break lower, as intraday studies turn down, with prices currently trading around 96.55. Daily readings are also under pressure and broader weekly charts are falling, suggesting a fresh deterioration in sentiment and room for further losses in the coming sessions. Focus is on congestion around 96.35, with a break opening up 96.00. Still lower is critical support within the 95.25 Fibonacci retracement and the 95.55 current year low of 27 January. Already oversold weekly stochastics could limit any initial tests of this range in short-covering/consolidation. Meanwhile, resistance remains at congestion around 97.00. A close above here, if seen, will help to stabilise price action and prompt consolidation beneath further congestion around 97.50.