Published: 2025-04-07T13:35:06.000Z
Chart AUD/USD Update: Limited gains from fresh 5-year low

Senior Technical Strategist
1
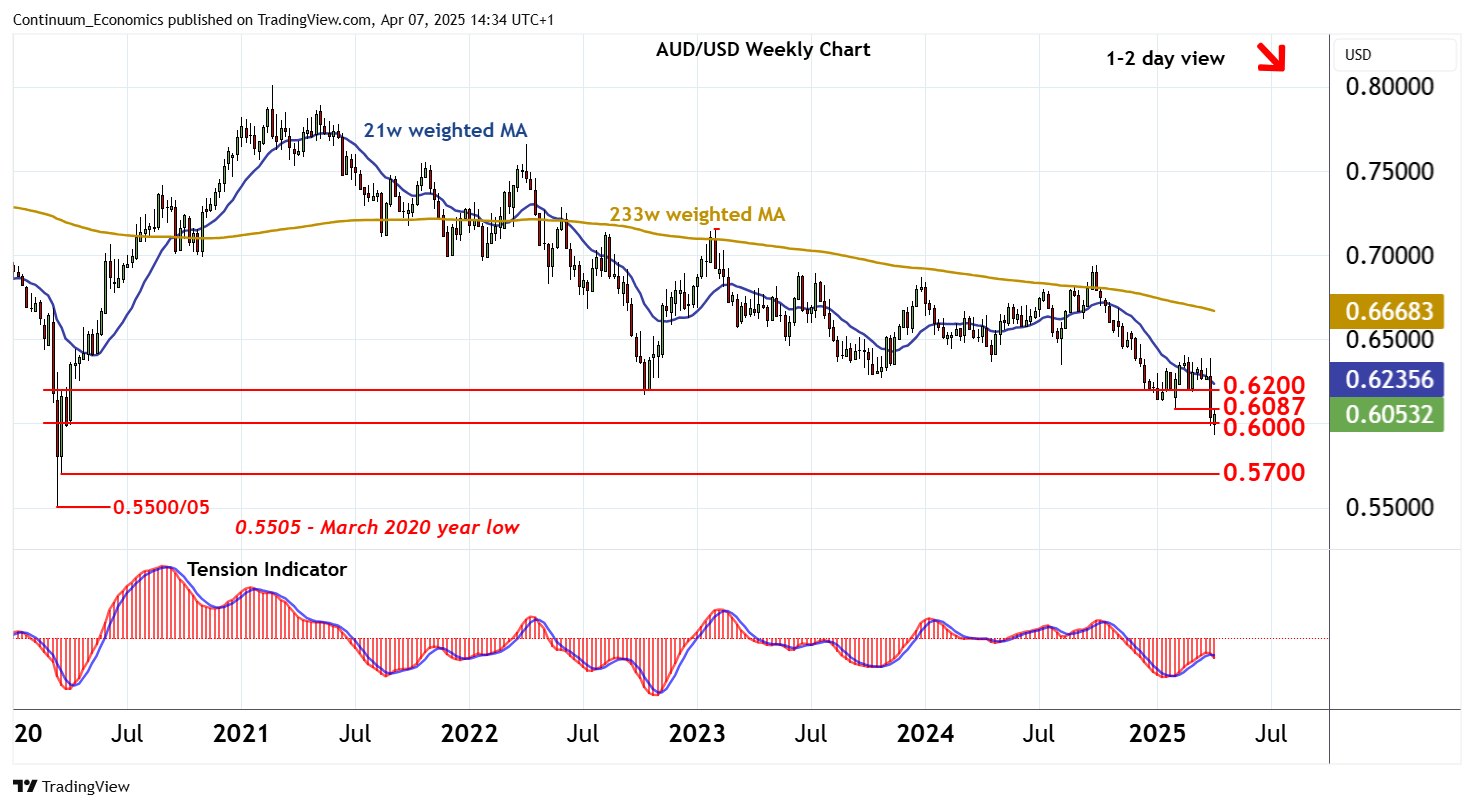
The spike to a fresh year low around 0.5930 has given way to a sharp bounce and consolidation above congestion support at 0.6000
| Levels | Imp | Comment | Levels | Imp | Comment | |||
|---|---|---|---|---|---|---|---|---|
| R4 | 0.6400/08 | ** | range highs; 21 Feb YTD high | S1 | 0.6000 | ** | historic congestion | |
| R3 | 0.6300 | ** | congestion | S2 | 0.5930 | current YTD low | ||
| R2 | 0.6250 | * | break level | S3 | 0.5700 | * | late-Mar 2020 (w) low | |
| R1 | 0.6200 | ** | congestion | S4 | 0.5500/05 | ** | March 2020 (y) low |
Asterisk denotes strength of level
14:25 BST - The spike to a fresh year low around 0.5930 has given way to a sharp bounce and consolidation above congestion support at 0.6000. Focus is on the 0.6087 monthly low of 3 February, but negative daily and weekly charts are expected to limit any break in renewed selling interest beneath congestion around 0.6200. Following choppy trade, fresh losses are looked for. A close below 0.6000 will add weight to sentiment and extend broad losses below 0.5930 towards the 0.5700 weekly low of late-March 2020.