Published: 2026-02-19T14:04:55.000Z
Chart USD/JPY Update: Higher in both USD- and JPY-driven trade
8
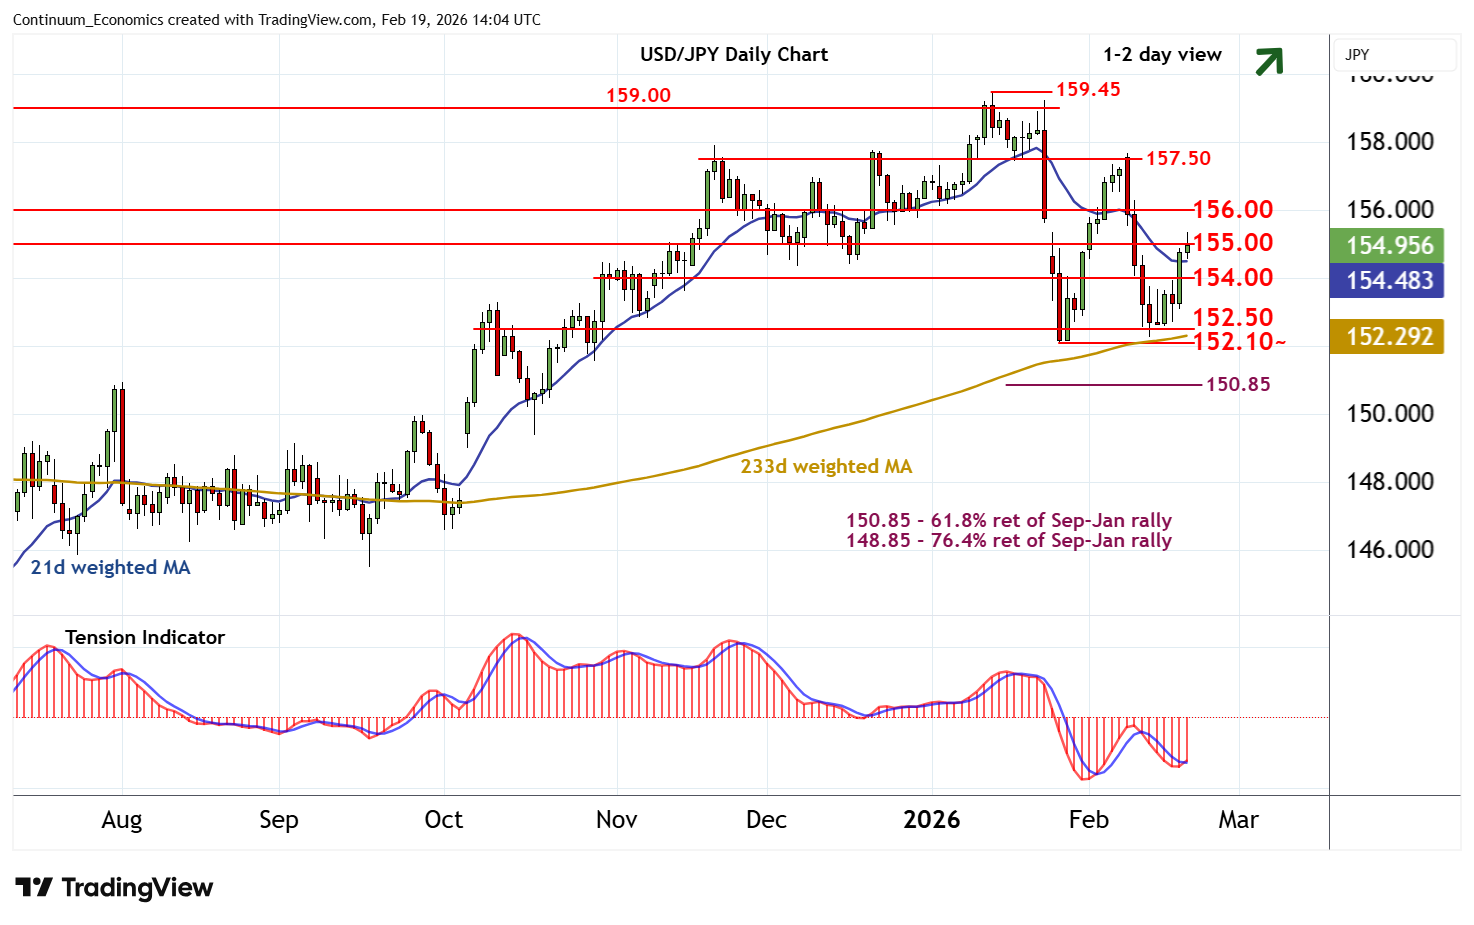
Anticipated tests higher have reached resistance at 155.00 in both USD- and JPY-driven trade
| Levels | Imp | Comment | Levels | Imp | Comment | |||
|---|---|---|---|---|---|---|---|---|
| R4 | 158.00 | * | break level | S1 | 154.00 | * | congestion | |
| R3 | 157.50 | * | congestion | S2 | 152.50 | * | congestion | |
| R2 | 156.00 | * | congestion | S3 | 152.10~ | ** | 27 Jan YTD low | |
| R1 | 155.00 | * | break level | S4 | 150.85 | ** | 61.8% ret of Sep-Jan rally |
Asterisk denotes strength of level
13:55 GMT - Anticipated tests higher have reached resistance at 155.00 in both USD- and JPY-driven trade, where unwinding overbought intraday studies are prompting short-term reactions. Daily stochastics and the daily Tension Indicator are improving, suggesting room for a test above here. But mixed/negative weekly charts should limit scope in renewed selling interest towards further congestion around 156.00. Meanwhile, support is raised to congestion around 154.00 and should underpin any immediate setbacks.