Published: 2026-03-25T00:20:03.000Z
Chart AUD/USD Update: Consolidating
1
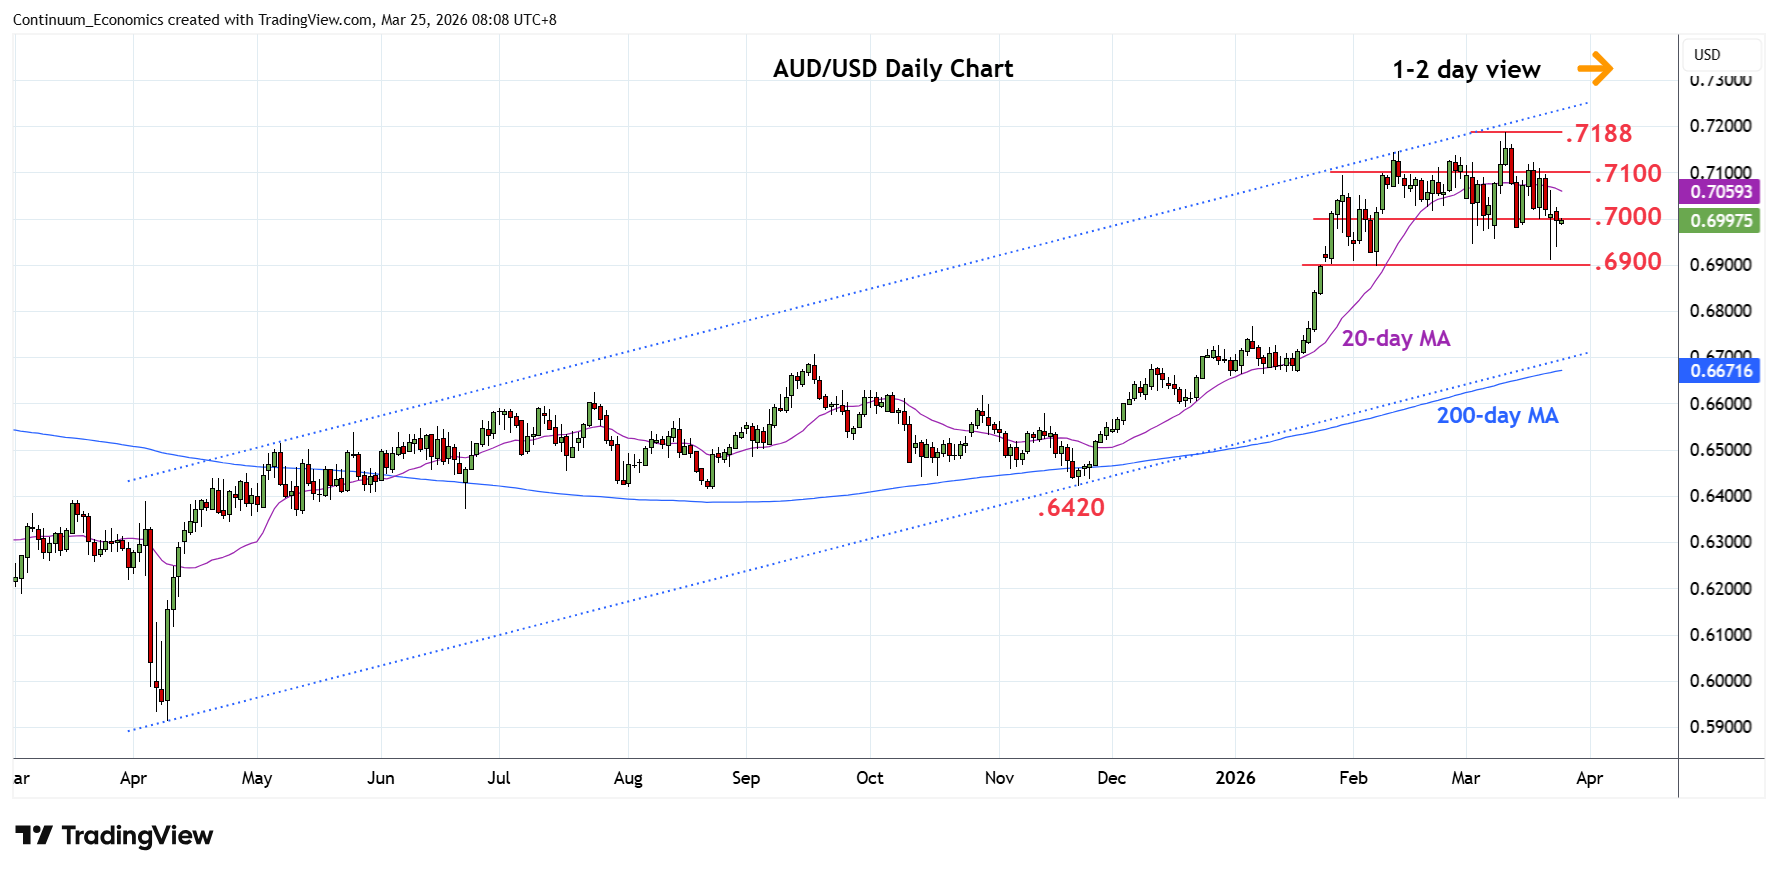
Little change, as prices return to consolidate around the .7000 level following bounce from .6910 and .6940 consecutive pin bar lows
| Levels | Imp | Comment | Levels | Imp | Comment | |||
|---|---|---|---|---|---|---|---|---|
| R4 | 0.7188 | ** | 11 Mar YTD high | S1 | 0.6945 | * | 3 Mar low | |
| R3 | 0.7147 | * | Feb high | S2 | 0.6910/00 | ** | 23 Mar, Feb lows | |
| R2 | 0.7100 | * | congestion | S3 | 0.6895 | * | 38.2% Nov/Mar rally | |
| R1 | 0.7050 | * | congestion | S4 | 0.6805/00 | * | 50%, congestion |
Asterisk denotes strength of level
00:10 GMT - Little change, as prices return to consolidate around the .7000 level following bounce from .6910 and .6940 consecutive pin bar lows. Further choppy trade can be expected but bias remains on the downside to extend losses from the .7188 current year high. Would take break of the .6910 low to extend losses to the .6900/.6895, support and 38.2% Fibonacci level. Meanwhile, resistance remains at the .7050/.7100 congestion area which is expected to cap. Would need to regain this to fade the downside pressure and open up the .7147 and .7188 highs to retest.