Chart USD Index DXY Update: Higher in range
Consolidating following the anticipated test of congestion support at 97.50 has given way to a sharp bounce
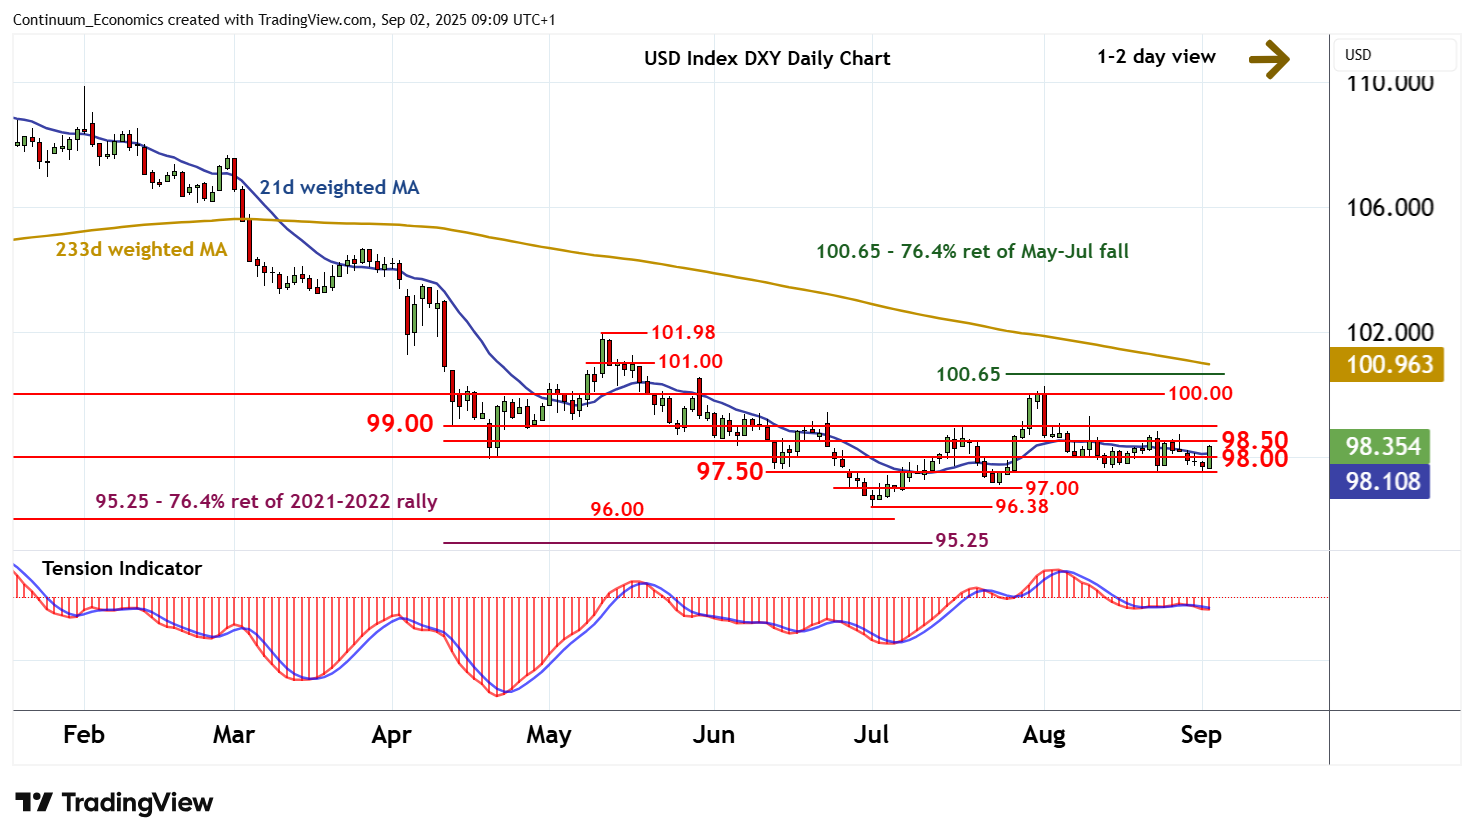
| Levels | Imp | Comment | Levels | Imp | Comment | |||
|---|---|---|---|---|---|---|---|---|
| R4 | 100.65 | ** | 76.4% ret of May-Jul fall | S1 | 98.00 | * | congestion | |
| R3 | 100.00 | ** | congestion | S2 | 97.50 | * | congestion | |
| R2 | 99.00 | * | break level | S3 | 97.00 | * | congestion | |
| R1 | 98.50 | congestion | S4 | 96.38 | ** | 1 Jul YTD low |
Asterisk denotes strength of level
09:05 BST - Consolidating following the anticipated test of congestion support at 97.50 has given way to a sharp bounce, with the break above 98.00 currently trading around 98.35. Intraday studies are rising and oversold daily stochastics are turning higher, highlighting room for a test of congestion resistance at 98.50. But the negative daily Tension Indicator and mixed weekly charts should limit any initial break in renewed consolidation beneath 99.00. A close above here, however, would improve sentiment and extend gains towards 100.00. Meanwhile, support is at congestion around 98.00 and extends to 97.50. This range should underpin any immediate setbacks.