Published: 2026-03-05T08:06:57.000Z
Chart EUR/AUD Update: Range-bound above 1.6420 low
1
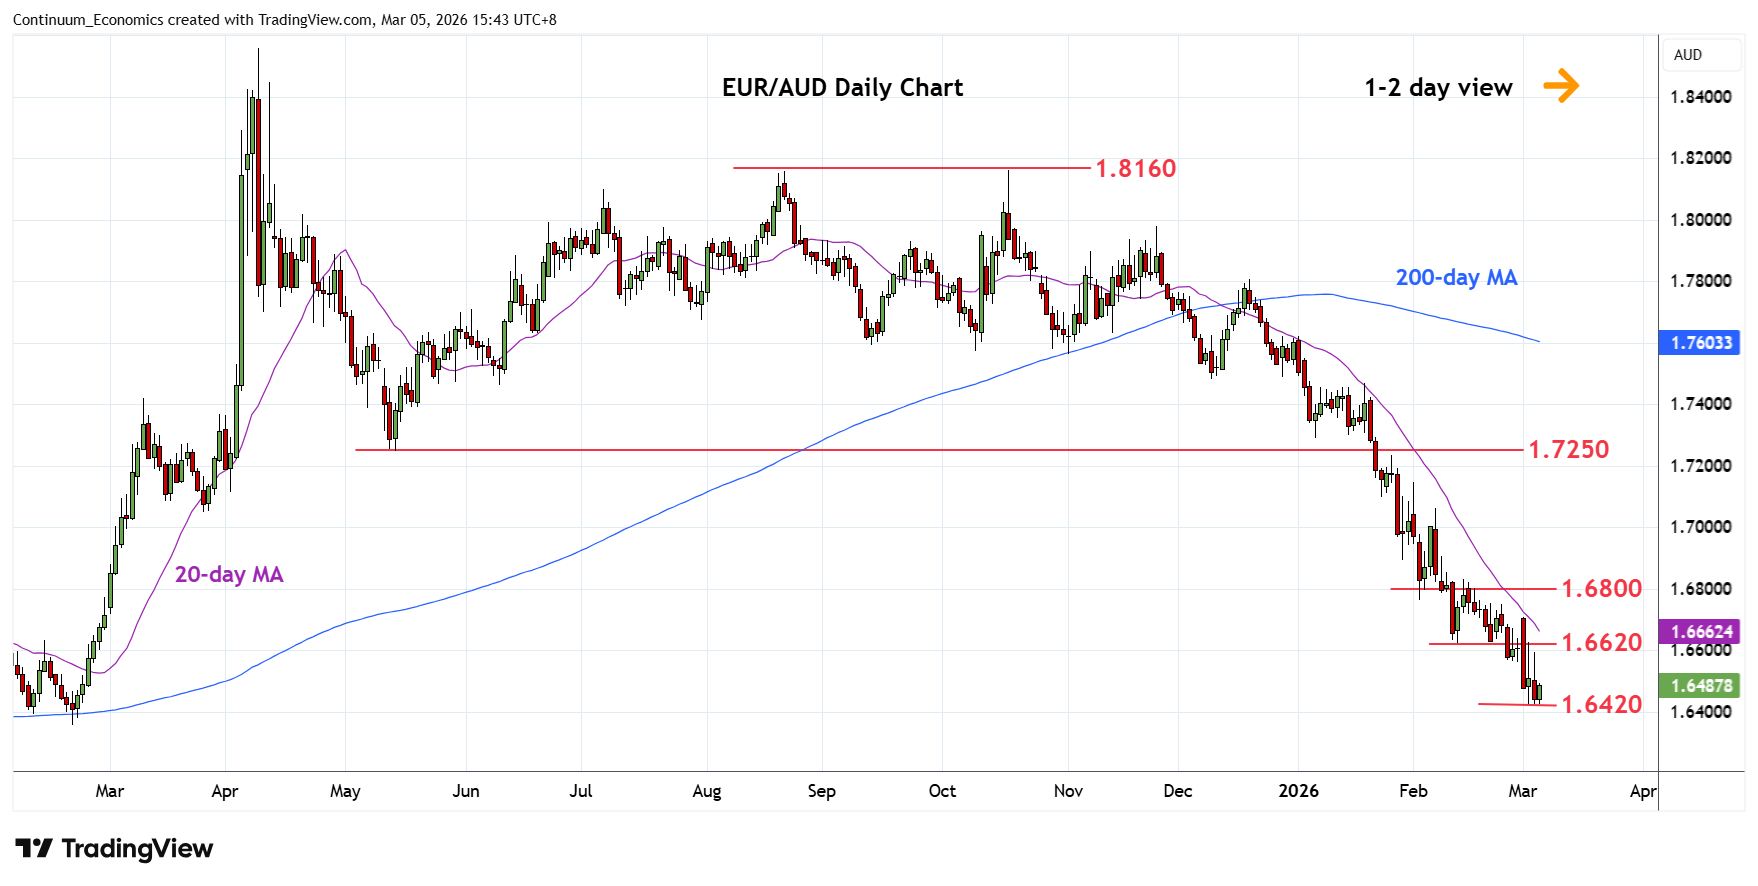
Range-bound in consolidation as prices holds steady above the 1.6420 low and 50% Fibonacci level
| Levels | Imp | Comment | Levels | Imp | Comment | |||
|---|---|---|---|---|---|---|---|---|
| R4 | 1.6900 | * | congestion | S1 | 1.6420 | ** | 3 Mar YTD low, 50% | |
| R3 | 1.6800 | * | congestion | S2 | 1.6360 | ** | 20 Feb 2025 year low | |
| R2 | 1.6700/50 | * | congestion | S3 | 1.6300 | * | congestion | |
| R1 | 1.6620 | * | 12 Feb low | S4 | 1.6200 | * | congestion |
Asterisk denotes strength of level
07:50 GMT - Range-bound in consolidation as prices holds steady above the 1.6420 low and 50% Fibonacci level but shallow bounce keep pressure on the downside. Oversold daily and weekly studies caution corrective bounce with resistance starting at 1.6620. Would need lift over this to open up room for stronger corrective bounce to retrace losses from the 1.8160, October high. Higher will see room to the 1.6700/50 area and 1.6800/1.6900 congestion. Failure to hold 1.6420 low will turn focus to the 1.6360, 2025 year low.