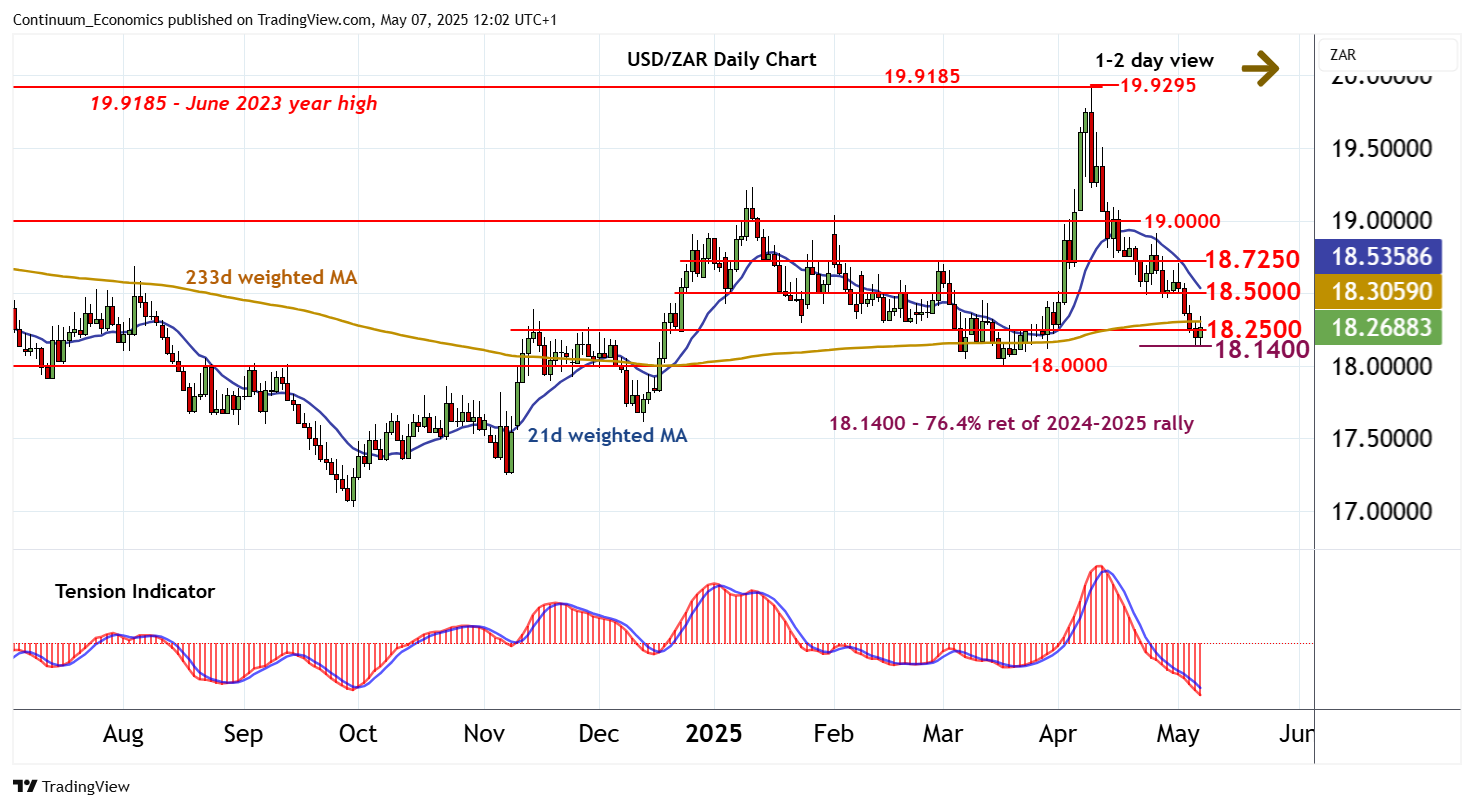
Chart USD/ZAR Update: Minor bounce from the 18.1400 Fibonacci retracement

The break below congestion around 18.2500 has reached strong support at the 18.1400 Fibonacci retracement
| Level | Comment | Level | Comment | |||||
|---|---|---|---|---|---|---|---|---|
| R4 | 19.0000 | ** | congestion | S1 | 18.2500 | * | congestion | |
| R3 | 18.9100~ | 25 Apr (w) high | S2 | 18.1400 | ** | 76.4% ret of 2024-2025 rally | ||
| R2 | 18.7250 | * | congestion | S3 | 18.0000 | ** | congestion | |
| R1 | 18.5000 | ** | break level | S4 | 17.8000 | congestion |
Asterisk denotes strength of level
11:55 BST - The break below congestion around 18.2500 has reached strong support at the 18.1400 Fibonacci retracement, where anticipated short-covering is prompting a bounce back above 18.2500. Rising intraday studies and a tick higher in oversold daily stochastics suggest potential for a further bounce. But the bearish daily Tension Indicator and negative weekly charts should limit scope in renewed selling interest beneath resistance at 18.5000. In the coming sessions, cautious trade is expected to give way to fresh losses. A later close below 18.1400 will add weight to sentiment and extend April losses towards congestion around 18.0000.