Published: 2025-02-18T16:52:30.000Z
Chart USD/MXN Update: Leaning lower

Senior Technical Strategist
2
Cautious trade is giving way to anticipated losses
| Levels | Imp | Comment | Levels | Imp | Comment | |||
|---|---|---|---|---|---|---|---|---|
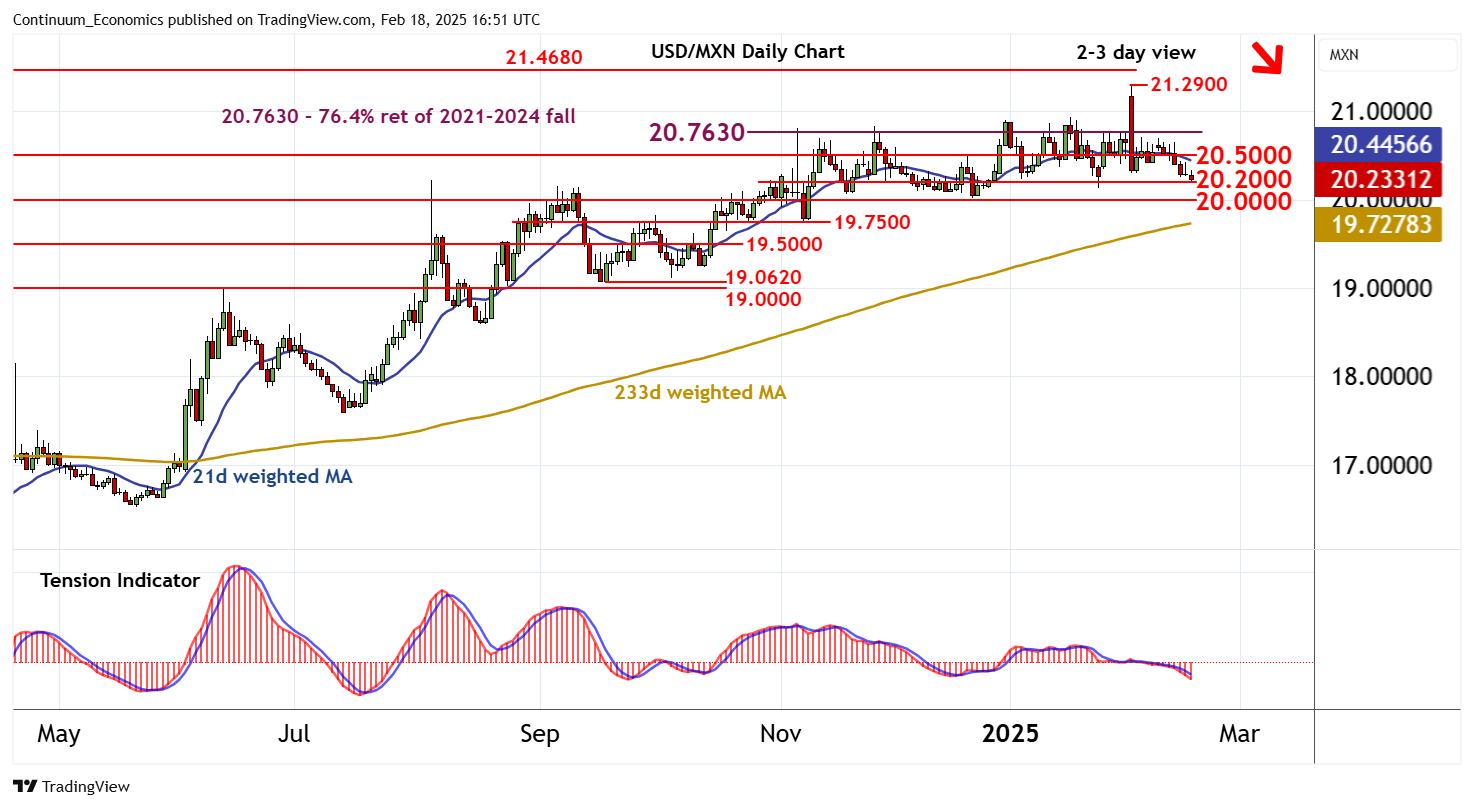
| R4 | 21.2900 | ** | 4 Feb YTD high | S1 | 20.2000 | break level | ||
| R3 | 20.9050 | ** | 31 Dec 2024 (y) high | S2 | 20.0000 | * | congestion | |
| R2 | 20.7630 | ** | 76.4% ret of 2021-2024 fall | S3 | 19.7500 | * | break level | |
| R1 | 20.5000 | * | congestion | S4 | 19.5000 | * | congestion |
Asterisk denotes strength of level
16:40 GMT - Cautious trade is giving way to anticipated losses, with prices currently pressuring support at 20.2000. A break will open up stronger support at congestion around 20.0000, where already oversold daily stochastics could prompt renewed consolidation. Broader weekly charts remain negative, however, pointing to room for a later break beneath here and completion of multi-week distribution top. Focus will then turn to 19.7500, with room for still deeper losses. Meanwhile, resistance is lowered to congestion around 20.5000. A close above here would turn sentiment neutral and prompt fresh consolidation beneath the 20.7630 Fibonacci retracement.