Published: 2026-04-24T07:48:46.000Z
Chart EUR/USD Update: Under pressure
-
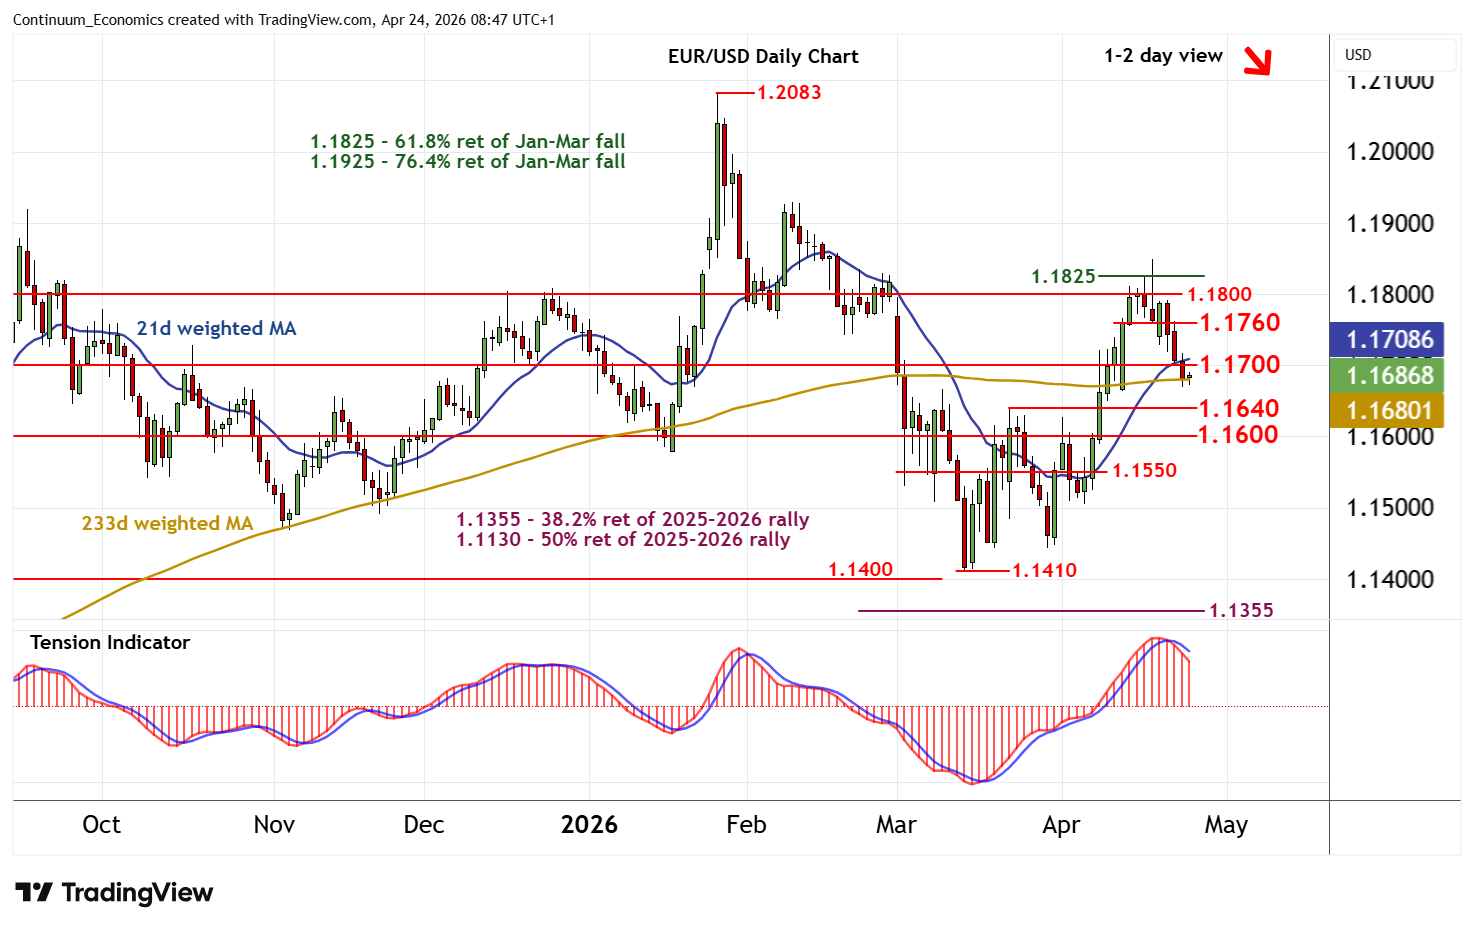
Anticipated selling interest has reached 1.1670
| Levels | Imp | Comment | Levels | Imp | Comment | |||
|---|---|---|---|---|---|---|---|---|
| R4 | 1.1825 | ** | 61.8% ret of Jan-Mar fall | S1 | 1.1670 | 23 Apr low | ||
| R3 | 1.1800 | ** | congestion | S2 | 1.1640 | ** | 23 Mar (w) high | |
| R2 | 1.1760 | break level | S3 | 1.1600 | ** | congestion | ||
| R1 | 1.1700 | ** | congestion | S4 | 1.1550 | * | congestion |
*Asterisk denotes strength of level
08:35 BST - Anticipated selling interest has reached 1.1670, where flat oversold intraday studies are prompting short-term reactions. Daily stochastics and the daily Tension Indicator continue to fall, highlighting room for a break beneath here and extension of mid-April losses towards the 1.1640 weekly high of 23 March. However, rising weekly charts should limit any initial tests in renewed buying interest/consolidation. Meanwhile, resistance is lowered to congestion around 1.1700. A close above here would help to stabilise price action and prompt consolidation beneath the 1.1760 break level.