Chart EUR/PLN Update: Cautious trade - studies under pressure

Little change, as prices extend consolidation 4.1650
| Levels | Imp | Comment | Levels | Imp | Comment | |||
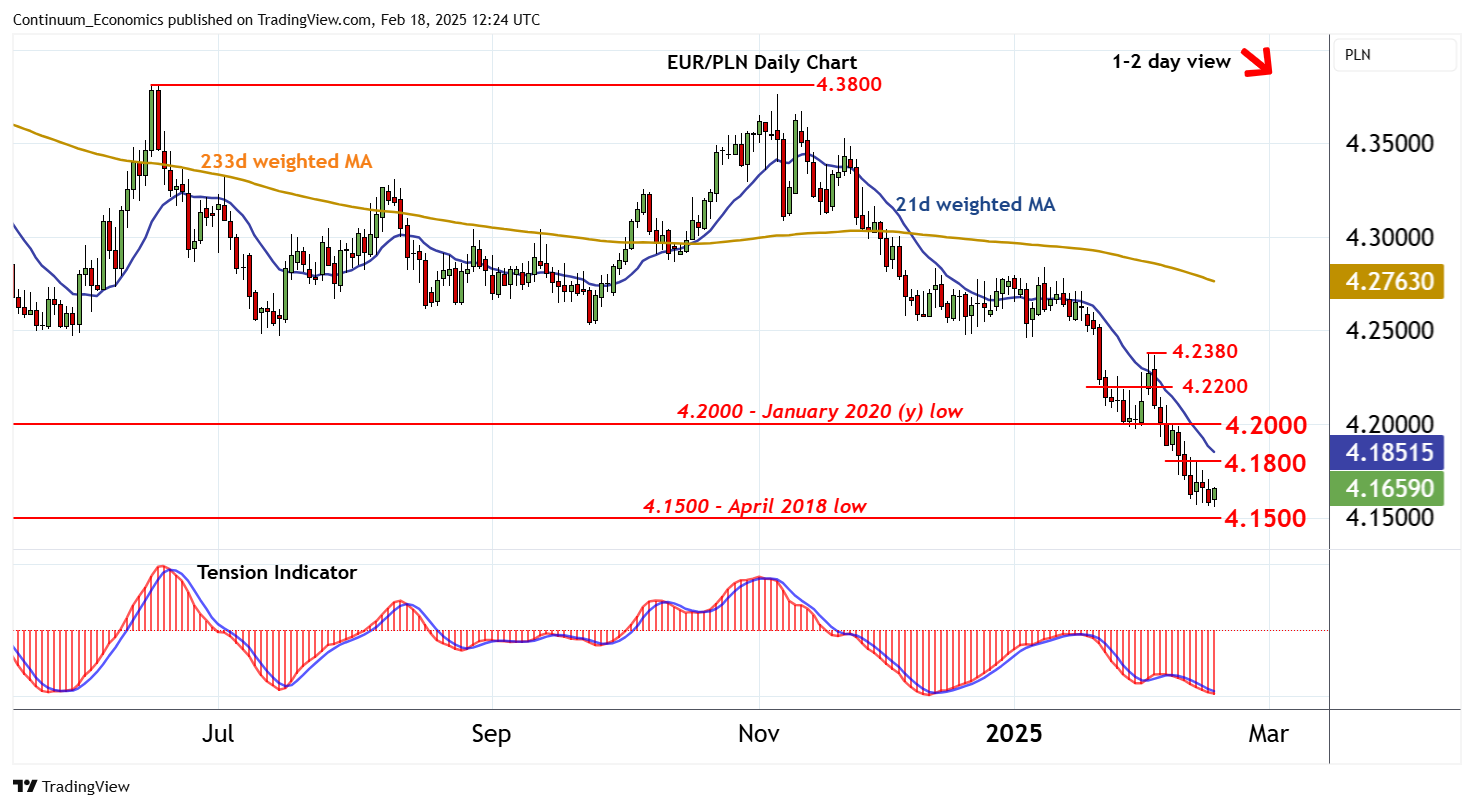
| R4 | 4.2380 | ** | 3 Feb (w) high | S1 | 4.1500 | * | April 2018 low | |
| R3 | 4.2200 | * | break level | S2 | 4.1300 | ** | January 2018 (y) low | |
| R2 | 4.2000 | ** | January 2020 (y) low, figure | S3 | 4.1000 | ** | 76.4% ret of 2010-2022 rally | |
| R1 | 4.1800 | break level | S4 | 4.0150 | * | May 2015 low |
Asterisk denotes strength of level
12:00 GMT - Little change, as prices extend consolidation 4.1650. Intraday studies are rising and daily stochastics are flattening above oversold areas, suggesting potential for a test higher. However, the negative daily Tension Indicator and deteriorating weekly charts are expected to limit scope in renewed selling interest towards resistance at the 4.1800 break level. A close above here, if seen, will help to stabilise price action and give way to consolidation beneath 4.2000. However, following cautious trade, fresh losses are looked for. A later break below support at the 4.1500 low of April 2018 will add weight to sentiment and extend losses towards the 4.1300 year low of January 2018. However, oversold stochastics could prompt short-covering/consolidation around here.