Published: 2025-09-18T00:29:49.000Z
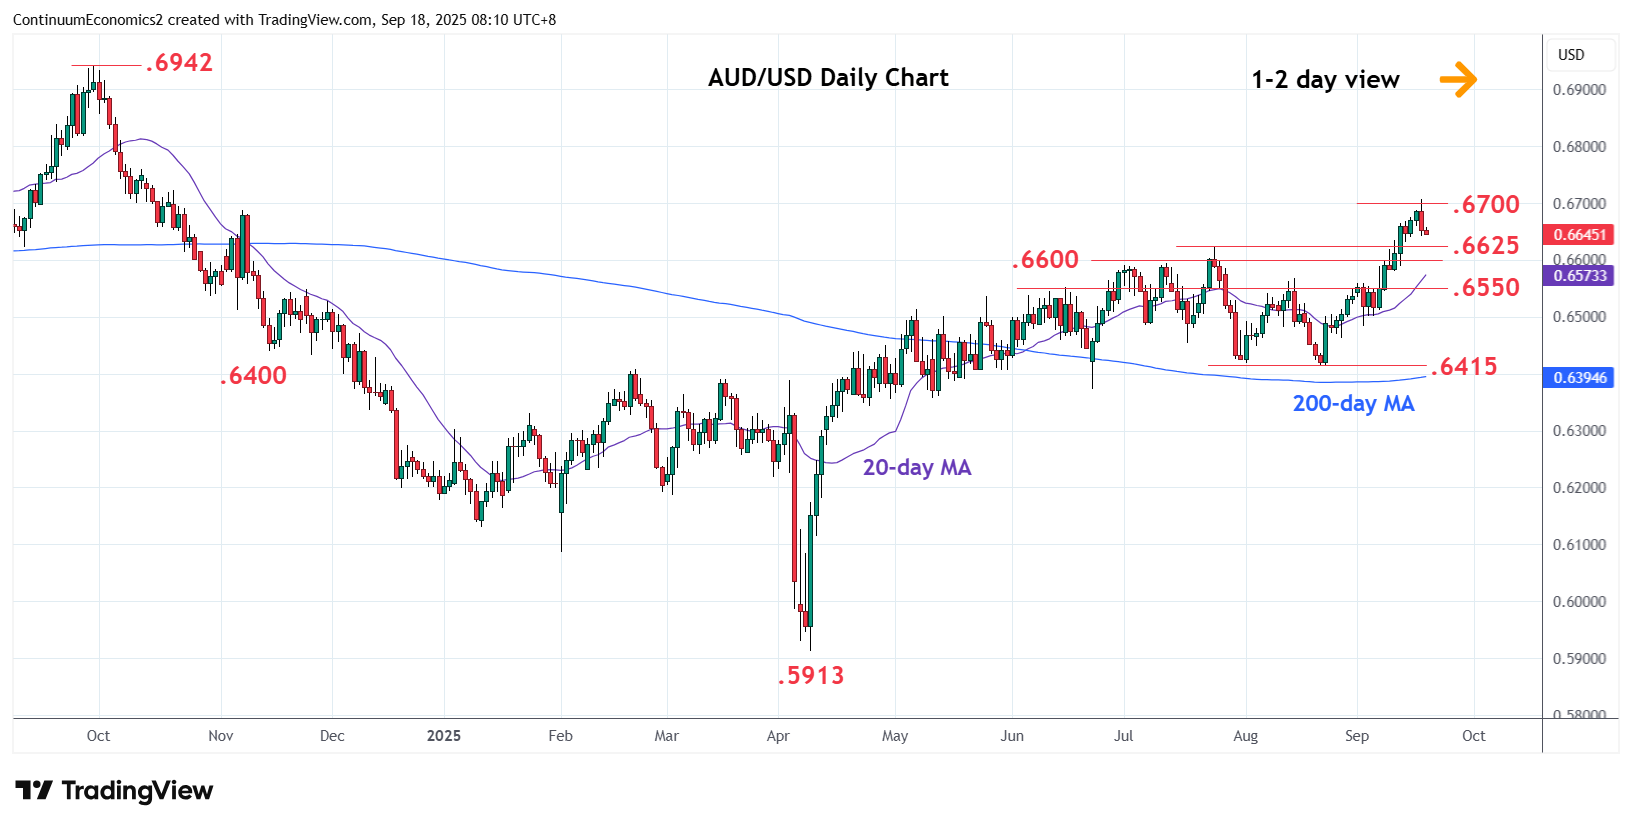
Chart AUD/USD Update: Corrective pullback from .6700/10 resistance
2
Settled back from test of resistance at .6700/10 congestion and 38.2% Fibonacci level as prices consolidate gains from the .6415, August low
| Levels | Imp | Comment | Levels | Imp | Comment | |||
|---|---|---|---|---|---|---|---|---|
| R4 | 0.6900/42 | ** | congestion, Sep 2024 year high | S1 | 0.6625/00 | ** | Jul high, congestion | |
| R3 | 0.6800/20 | * | congestion | S2 | 0.6550 | ** | congestion | |
| R2 | 0.6750 | * | congestion | S3 | 0.6500 | * | congestion | |
| R1 | 0.6700/10 | ** | figure, 38.2% 2021/Apr fall | S4 | 0.6462 | * | 27 Aug low |
Asterisk denotes strength of level
00:20 GMT - Settled back from test of resistance at .6700/10 congestion and 38.2% Fibonacci level as prices consolidate gains from the .6415, August low. Intraday and daily studies are unwinding overbought readings and pullback see room to the recent highs at the .6625/00 area. Failure here will open up room for deeper correction to strong support at the .6550 congestion. Correction expected to give way to renewed buying interest later to retest .6700/10 resistance. Clearance will turn focus to the .6942, 2024 year high.