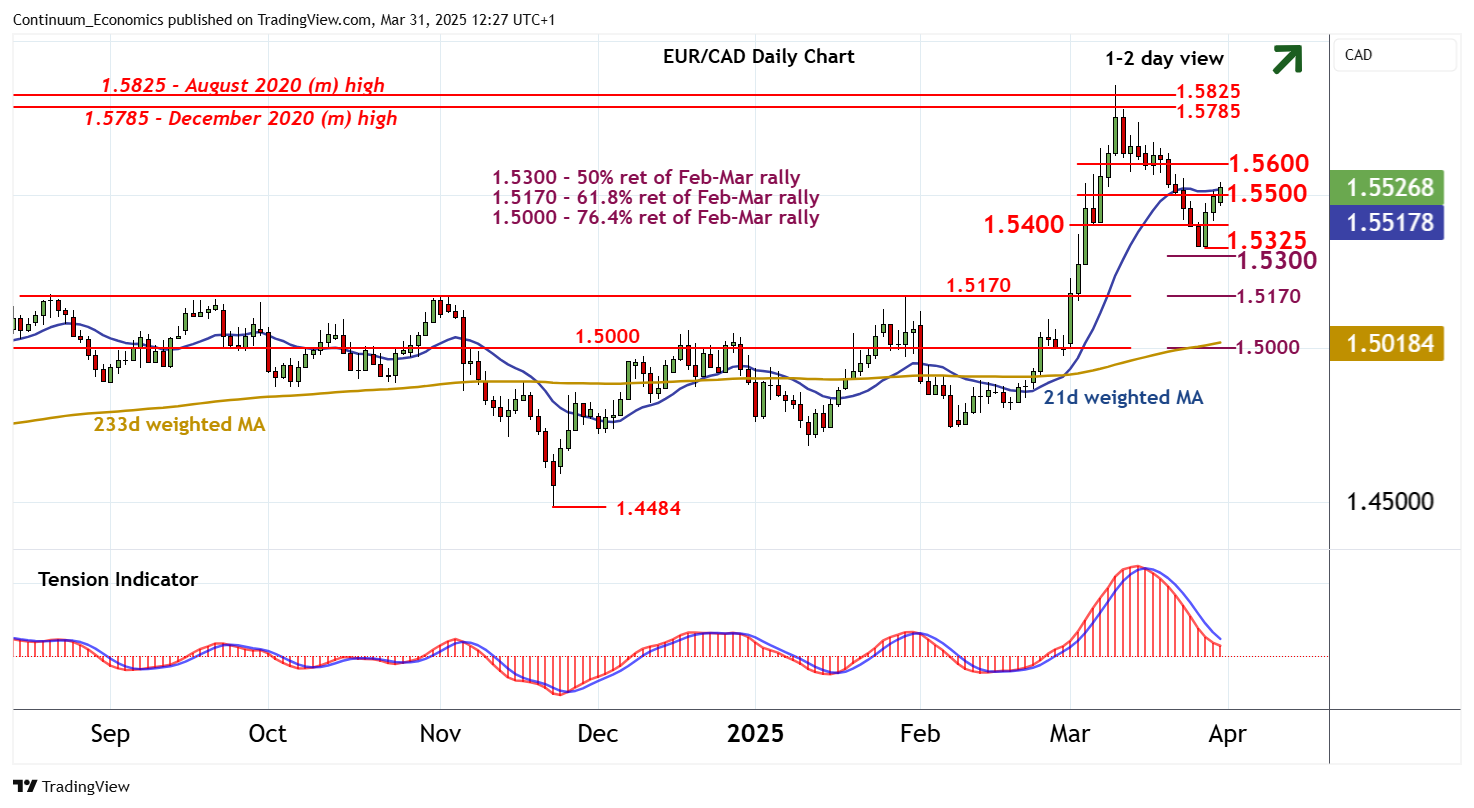
Chart EUR/CAD Update: Limited gains

The bounce from the 1.5325 weekly low of 27 March has reached 1.5530
| Level | Comment | Level | Comment | |||||
|---|---|---|---|---|---|---|---|---|
| R4 | 1.5785 | ** | December 2020 (m) high | S1 | 1.5500 | ** | congestion | |
| R3 | 1.5700 | break level | S2 | 1.5400 | * | congestion | ||
| R2 | 1.5672 | 18 Mar (w) high | S3 | 1.5325 | ** | 27 Mar (w) low | ||
| R1 | 1.5600 | * | congestion | S4 | 1.5300 | * | 50% ret of Feb-Mar rally |
Asterisk denotes strength
11:55 BST - The bounce from the 1.5325 weekly low of 27 March has reached 1.5530, where overbought intraday studies are prompting short-term reactions. Oversold daily stochastics are unwinding, suggesting room for continuation towards congestion resistance at 1.5600. But the negative daily Tension Indicator and a tick lower in overbought weekly stochastics should limit any break in renewed selling interest beneath 1.5700. Meanwhile, support is down to congestion around 1.5400 and should underpin any immediate setbacks. A close below 1.5325 and the 1.5300 Fibonacci retracement is needed to turn sentiment negative and confirm continuation of March losses.