Published: 2026-03-13T00:41:58.000Z
Chart NZD/USD Update: Under pressure
1
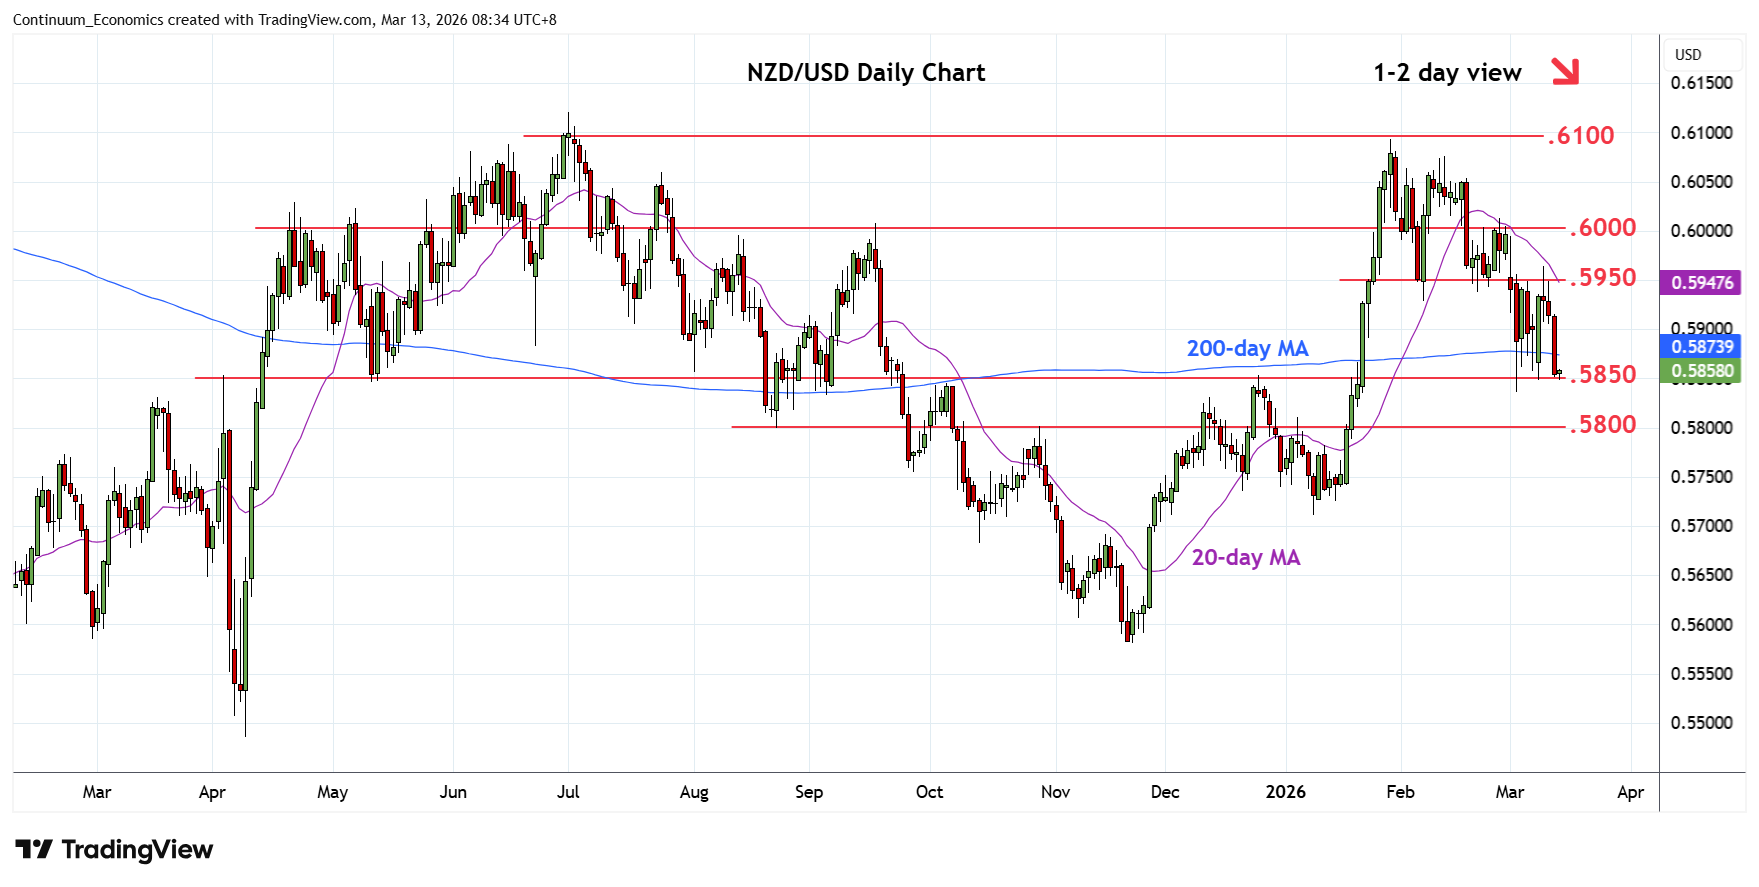
Choppy trade within the .5950/.5850 area see pressure returning to the .5850 support
| Levels | Imp | Comment | Levels | Imp | Comment | |||
|---|---|---|---|---|---|---|---|---|
| R4 | .6050 | * | congestion | S1 | .5850 | * | Dec high, congestion | |
| R3 | .6000/10 | ** | congestion, 26 Feb high | S2 | .5836 | * | 3 Mar low, 50% | |
| R2 | .5950 | ** | congestion | S3 | .5800 | ** | congestion | |
| R1 | .5900 | * | congestion | S4 | .5775 | * | 61.8% Nov/Jan rally |
Asterisk denotes strength of level
00:35 GMT - Choppy trade within the .5950/.5850 area see pressure returning to the .5850 support. Negative daily and weekly studies suggest scope for break here and the .5836 low of 3 March and 50% Fibonacci level to open up room for deeper pullback to retrace the November/January rally. Lower, will turn focus to strong support at .5800/.5775, congestion and 61.8% Fibonacci level. Meanwhile, resistance is lowered to the .5900/.5950 congestion which is expected expected to cap and sustain losses from the .6093, January current year high.