Published: 2026-01-27T00:23:01.000Z
Chart AUD/USD Update: Consolidating test of .6942, 2024 year high
1
Consolidating test of the .6942 resistance as prices unwind overbought intraday and daily studies
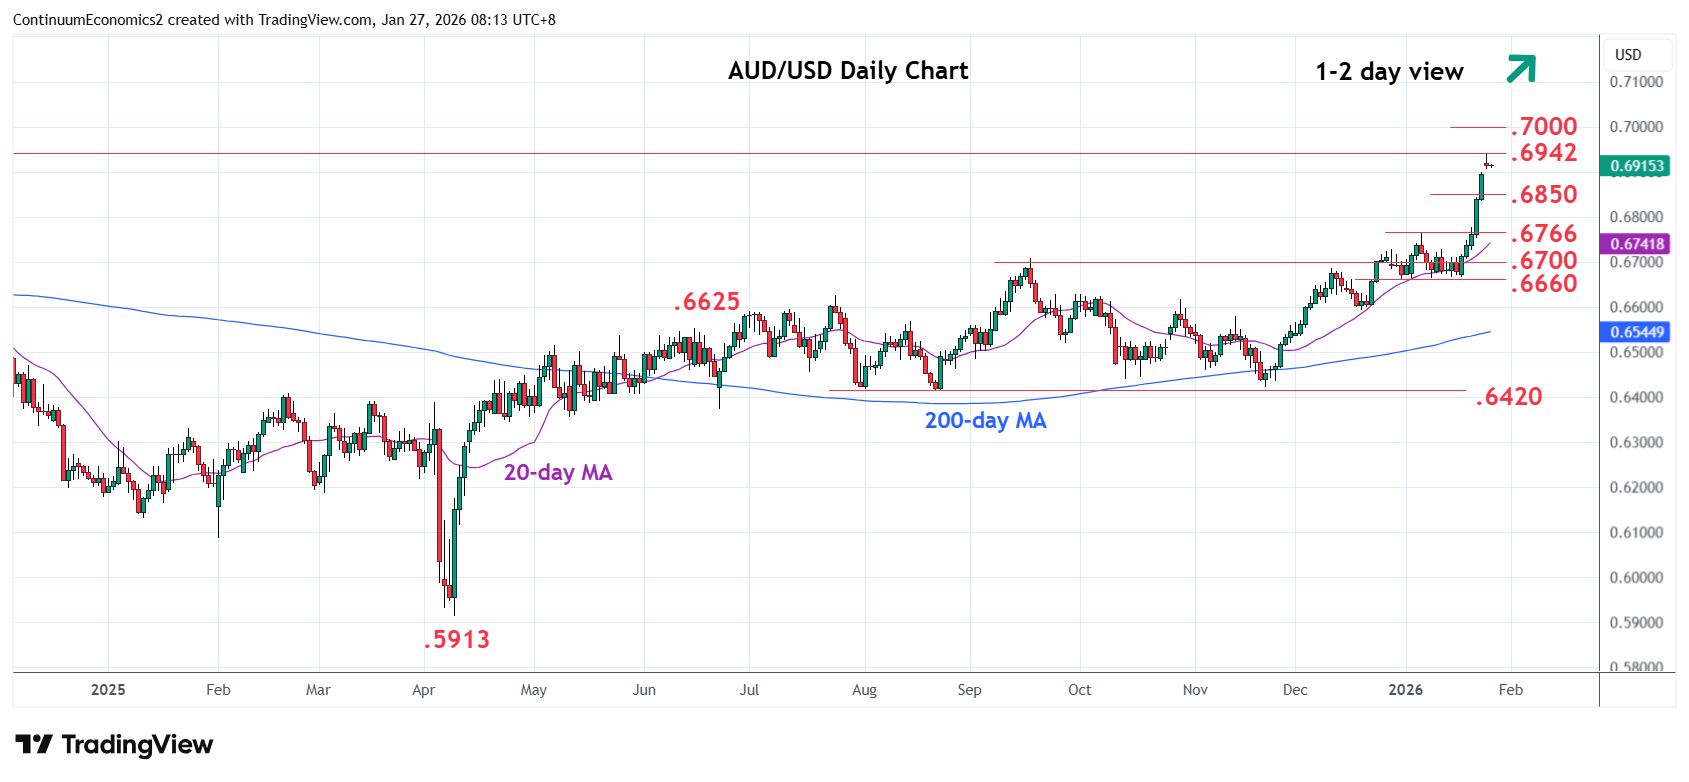
| Levels | Imp | Comment | Levels | Imp | Comment | |||
|---|---|---|---|---|---|---|---|---|
| R4 | 0.7050 | congestion | S1 | 0.6850 | * | congestion | ||
| R3 | 0.7000 | ** | figure, congestion | S2 | 0.6800 | * | congestion | |
| R2 | 0.6960 | * | 50% 2021/2025 fall | S3 | 0.6766 | ** | 7 Jan high | |
| R1 | 0.6942 | ** | Sep 2024 year high | S4 | 0.6727/00 | ** | Dec, Sep highs |
Asterisk denotes strength of level
00:15 GMT - Consolidating test of the .6942 resistance as prices unwind overbought intraday and daily studies following strong gains from the .6660 support. However, pressure remains on the upside and a later will open up room for extension to .6960, a 50% Fibonacci level, then the .7000 figure. Meanwhile, support is raised to the gap at the .6900 level and Friday's high. Below this will see room for deeper pullback to support at the .6850/.6800 congestion. This area now expected to underpin and sustain strong gains from the recent November swing low.