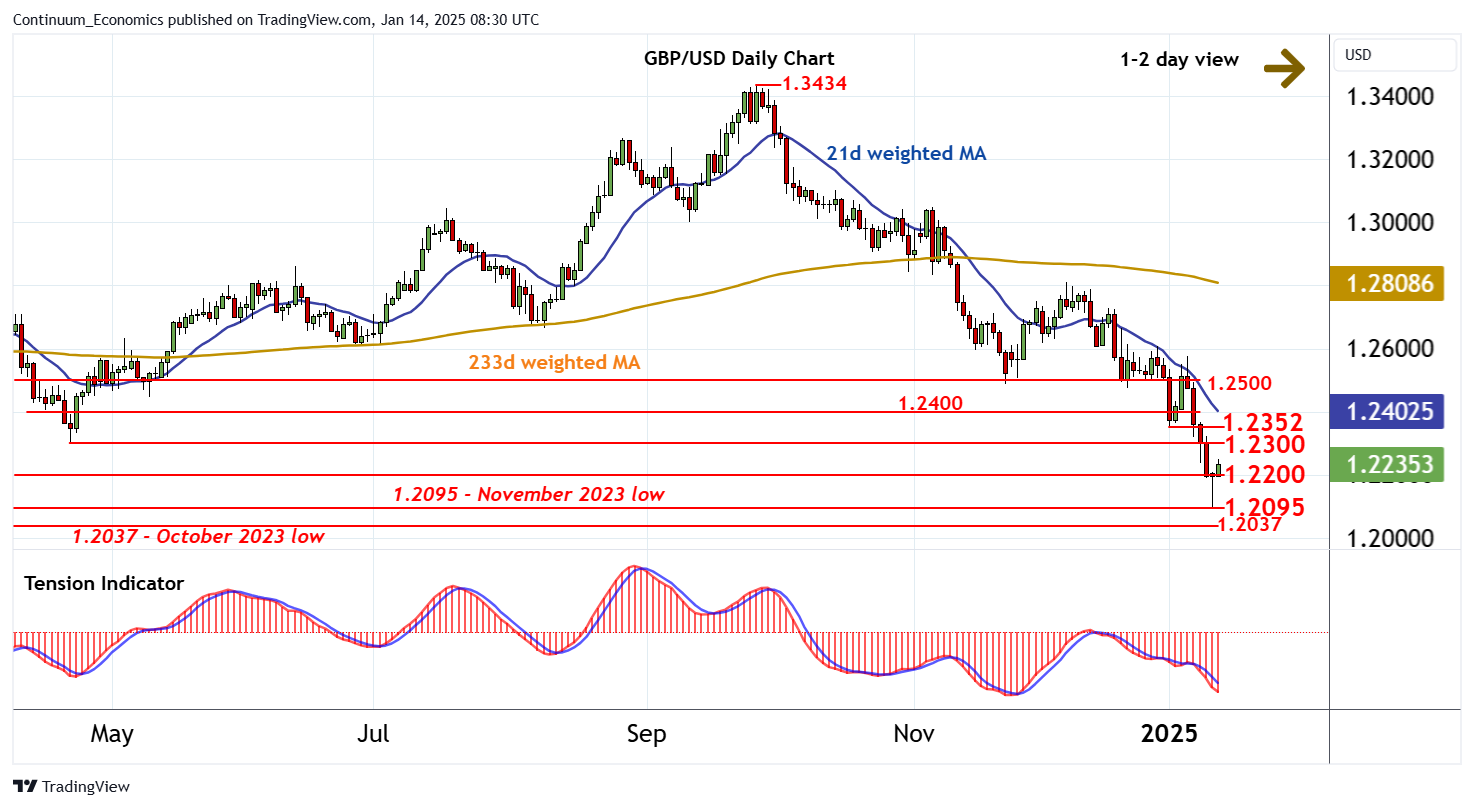
Chart GBP/USD Update: Bouncing from lows - resistance at 1.2300

The anticipated test of support at the 1.2095 low of November 2023 has given way to a steady bounce

| Level | Comment | Level | Comment | |||||
|---|---|---|---|---|---|---|---|---|
| R4 | 1.2500 | ** | break level | S1 | 1.2200 | * | congestion | |
| R3 | 1.2400 | minor congestion | S2 | 1.2095 | ** | November 2023 low | ||
| R2 | 1.2352 | * | 2 Jan (w) low | S3 | 1.2037 | ** | October 2023 (m) low | |
| R1 | 1.2300 | ** | 22 April 2024 (y) low | S4 | 1.2000 | ** | figure |
Asterisk denotes strength of level
08:10 GMT - The anticipated test of support at the 1.2095 low of November 2023 has given way to a steady bounce, with the close above 1.2200 turning sentiment neutral. Prices are currently balanced around 1.2235, as overbought intraday studies flatten. But a tick higher in oversold daily stochastics highlight potential for extension towards resistance at 1.2300. The negative daily Tension Indicator and bearish weekly charts, however, are expected to limit any initial tests in fresh consolidation. Meanwhile, a close below 1.2200, not yet seen, would add weight to sentiment. But a further close below the 1.2037 monthly low of October 2023 and congestion around 1.2000 is needed to turn price action outright negative and confirm continuation of September 2024 losses.