Published: 2026-03-19T00:56:44.000Z
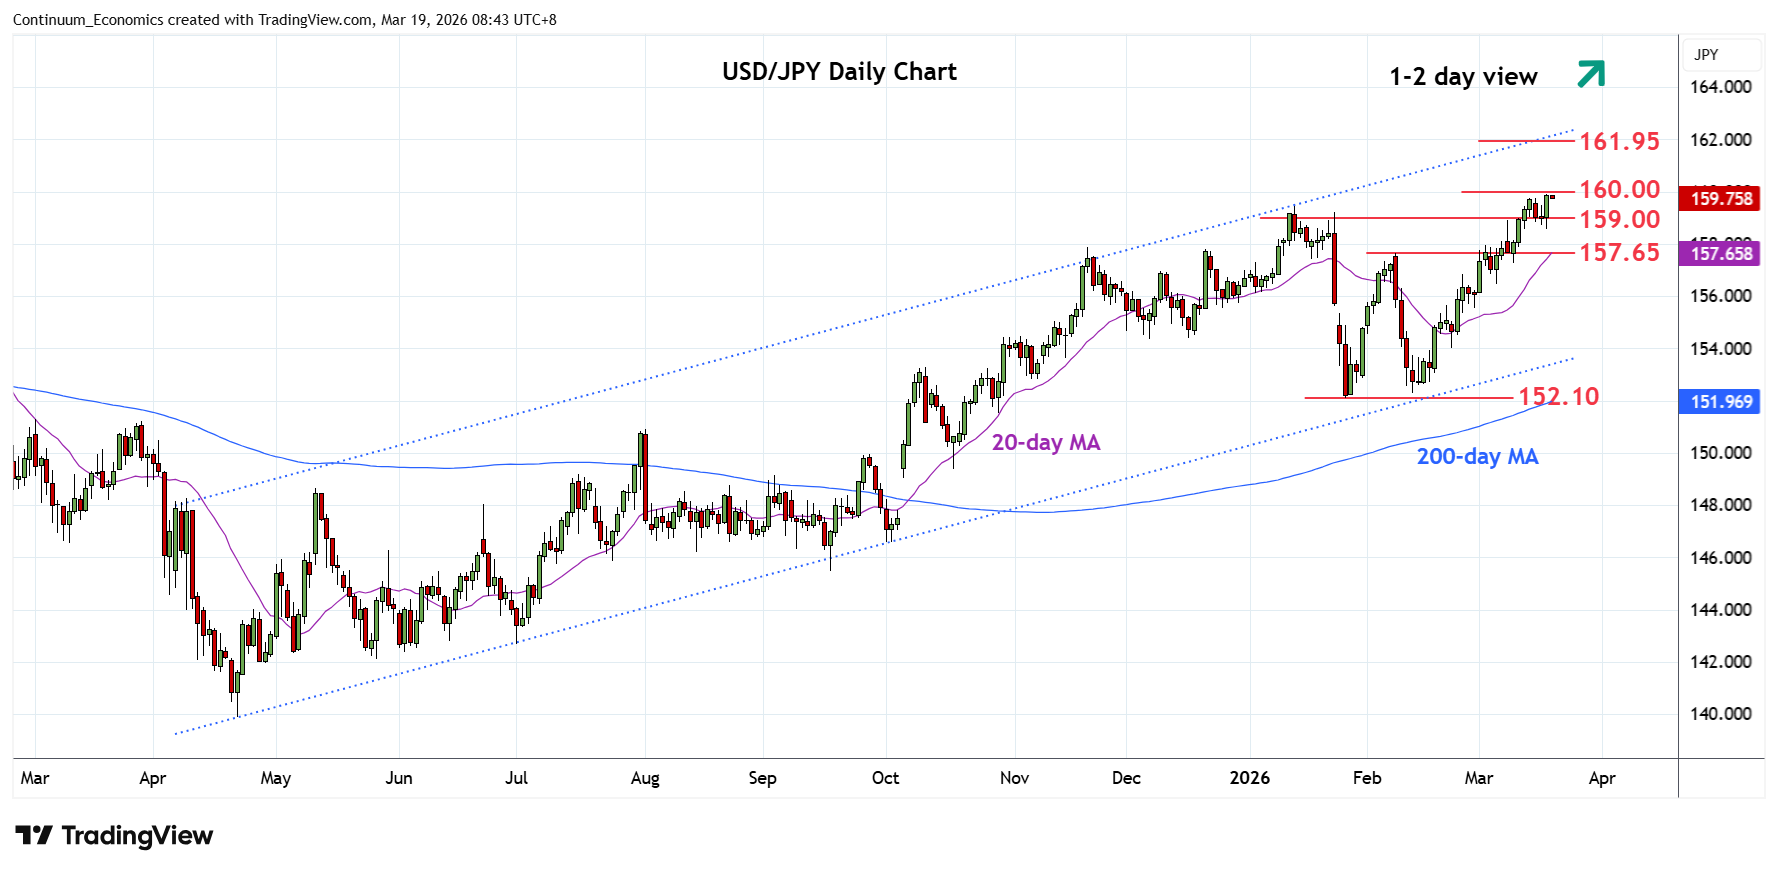
Chart USD/JPY Update: Just shy of 160.00
1
Limited on break below the 159.00 level and subsequent bounce from 158.57 low has seen gains to reach fresh high at 159.90
| Levels | Imp | Comment | Levels | Imp | Comment | |||
|---|---|---|---|---|---|---|---|---|
| R4 | 161.95 | ** | Jul 2024 year high | S1 | 159.00 | * | congestion | |
| R3 | 161.00 | * | figure, congestion | S2 | 158.57 | * | 18 Mar low | |
| R2 | 160.00 | ** | figure | S3 | 158.00 | * | congestion | |
| R1 | 159.75 | ** | 13 Mar YTD high | S4 | 157.65 | ** | 9 Feb high |
Asterisk denotes strength of level
00:50 GMT - Limited on break below the 159.00 level and subsequent bounce from 158.57 low has seen gains to reach fresh high at 159.90. Daily studies are stretched but pressure remains on the upside and break above the 160.00 level cannot be ruled out. Clearance will further extend gains within the bullish channel from the April low and see room to the 161.00 level then the 161.95, 2024 year high. Meanwhile, support at the 159.00/158.57 area now underpin. Only below here will open up room for corrective pullback to the 158.00 level and 157.65 support.