Published: 2026-02-27T17:01:37.000Z
Chart USD/CAD Update: Lower in CAD-driven trade
7
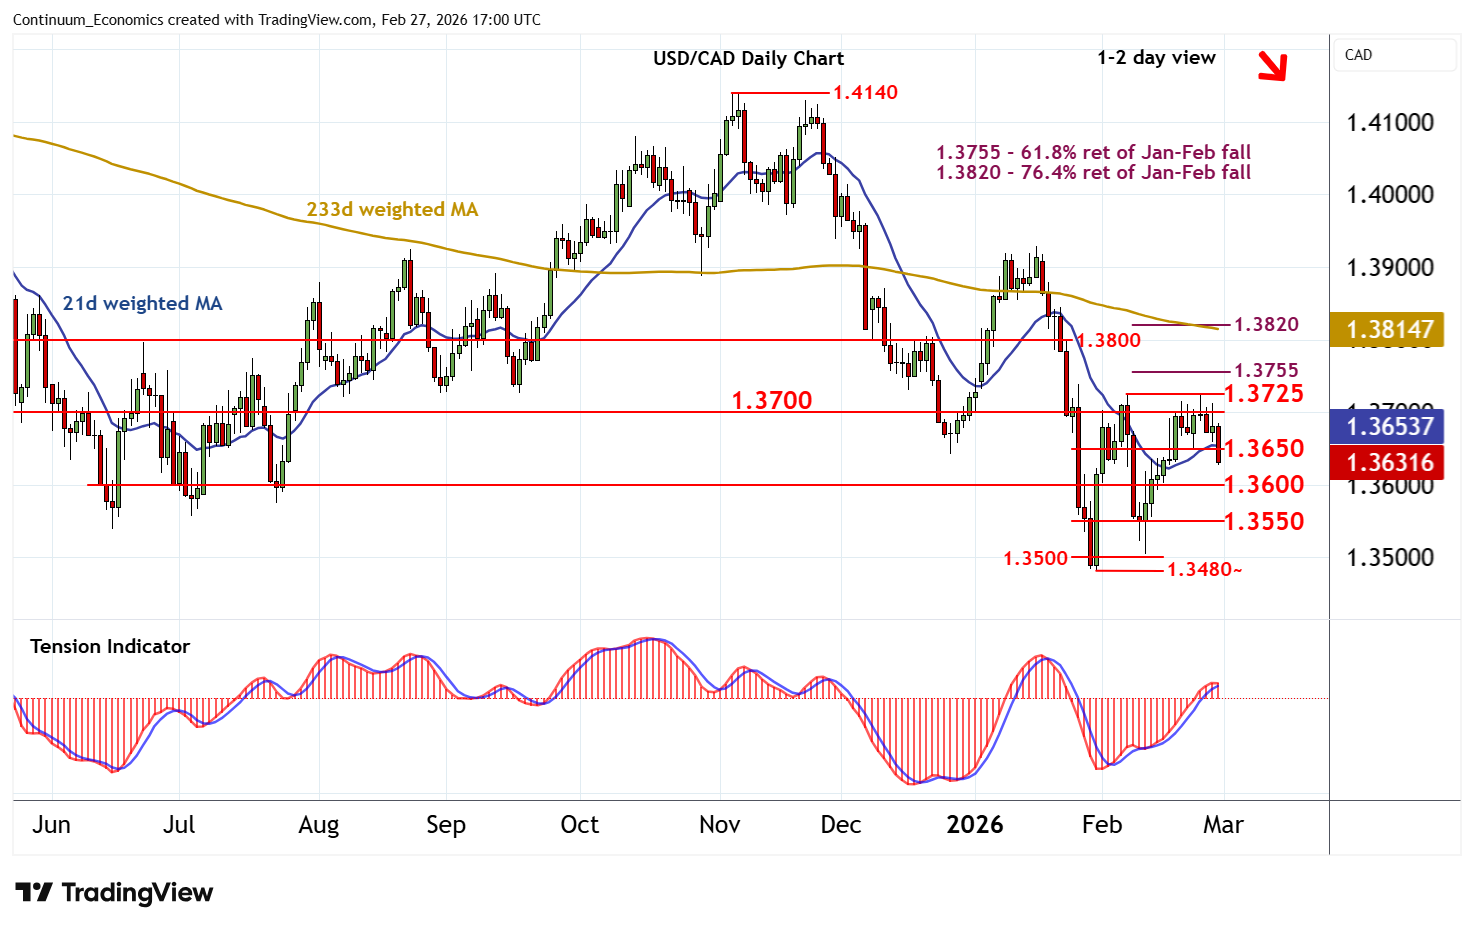
Choppy trade failed to make headway beyond resistance at congestion around 1.3700 and the 1.3725 weekly high of 6 February
| Levels | Imp | Comment | Levels | Imp | Comment | |||
|---|---|---|---|---|---|---|---|---|
| R4 | 1.3755 | ** | 61.8% ret of Jan-Feb fall | S1 | 1.3600 | * | congestion | |
| R3 | 1.3725 | * | 6 Feb (w) high | S2 | 1.3550 | congestion | ||
| R2 | 1.3700 | * | congestion | S3 | 1.3500 | ** | congestion | |
| R1 | 1.3650 | minor congestion | S4 | 1.3480~ | ** | 30 Jan YTD low |
Asterisk denotes strength of level
16:35 GMT - Choppy trade failed to make headway beyond resistance at congestion around 1.3700 and the 1.3725 weekly high of 6 February, with consolidation giving way to a sharp pullback in CAD-driven trade. Intraday studies are falling and daily readings have turned down, highlighting room for a test of congestion support at 1.3600. Still lower is 1.3550, but mixed/positive weekly charts should limit any tests in renewed consolidation. Meanwhile, an immediate close back above congestion resistance at 1.3650, if seen, should give way to fresh consolidation beneath 1.3700/25.