Published: 2026-03-27T01:47:58.000Z
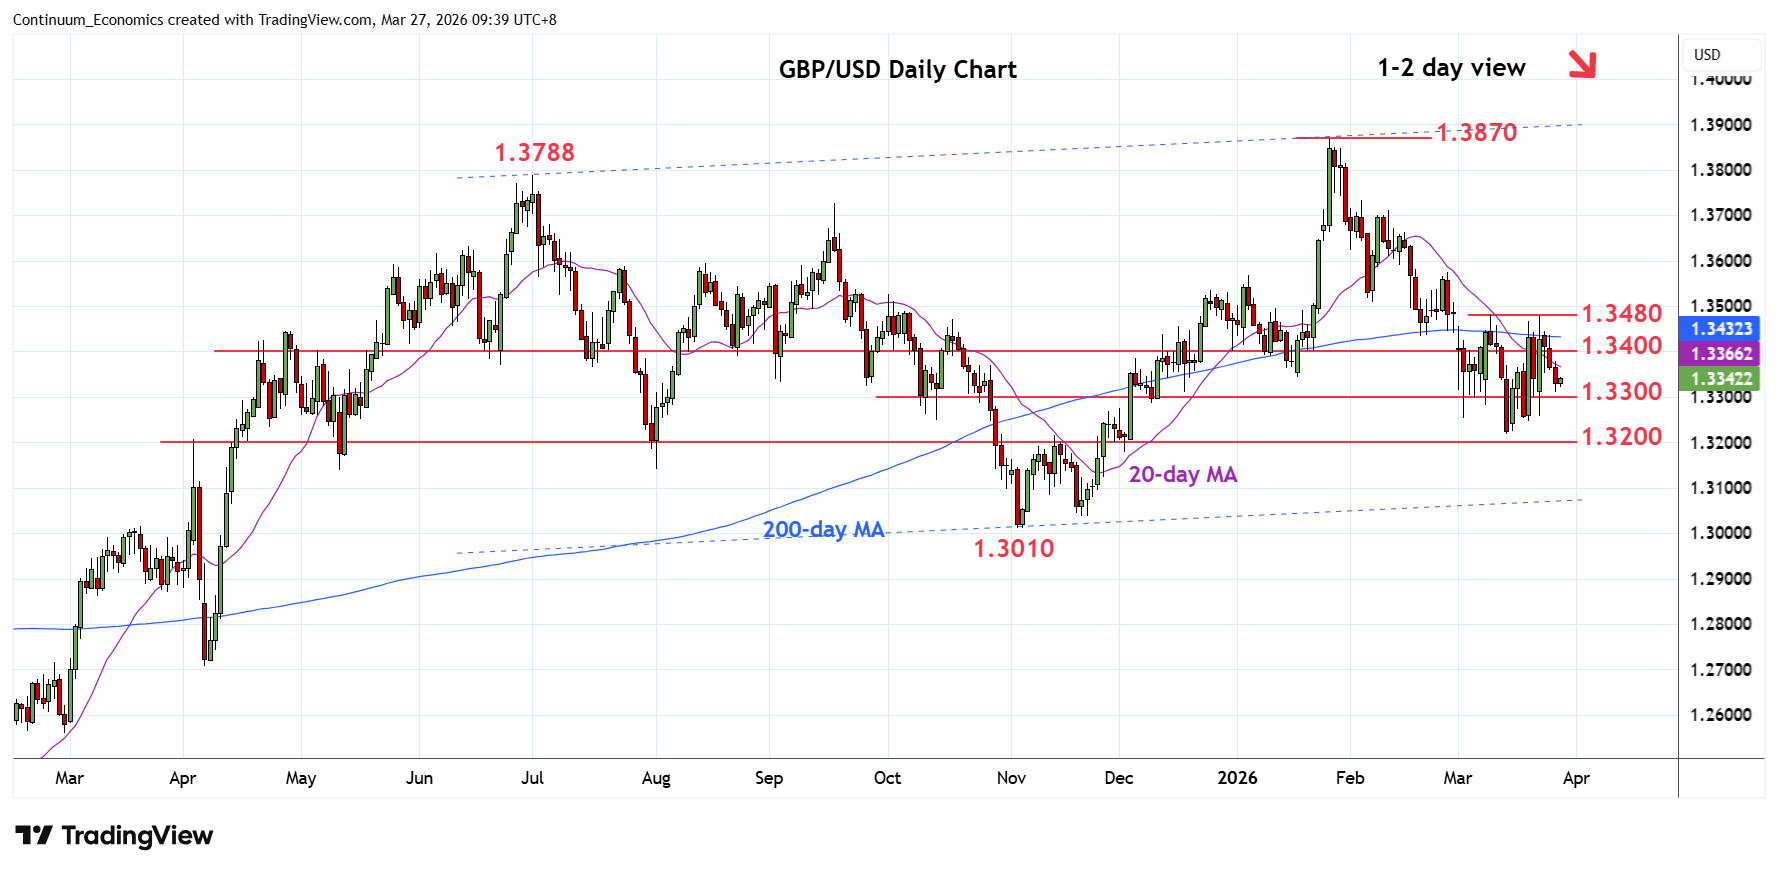
Chart GBP/USD Update: Extending pullback from 1.3480 high
2
Turned lower from test of resistance at the 1.3435/80, 200-day MA and 23 March high
| Level | Comment | Level | Comment | |||||
|---|---|---|---|---|---|---|---|---|
| R4 | 1.3500/10 | ** | congestion, 6 Feb low | S1 | 1.3300 | * | congestion | |
| R3 | 1.3480 | ** | 23 Mar high | S2 | 1.3250 | * | congestion | |
| R2 | 1.3435 | * | 200-day MA | S3 | 1.3213 | ** | 13 Mar YTD low | |
| R1 | 1.3400 | * | congestion | S4 | 1.3200 | * | congestion |
Asterisk denotes strength of level
01:45 GMT - Turned lower from test of resistance at the 1.3435/80, 200-day MA and 23 March high. Below the 1.3400 level see room to the 1.3300 congestion which should underpin. Break here will return focus to the downside for retest of the 1.3250 congestion and 1.3213, 13 March YTD low. Below the latter will further extend the January losses and turn focus to 1.3010, November low. Meanwhile, resistance is lowered to the 1.3400 level which is expected to cap and sustain losses from resistance at the 1.3480 lower high.