Chart GBP/USD Update: Leaning lower
Cautious trade has given way to the anticipated test lower
| Level | Comment | Level | Comment | |||||
|---|---|---|---|---|---|---|---|---|
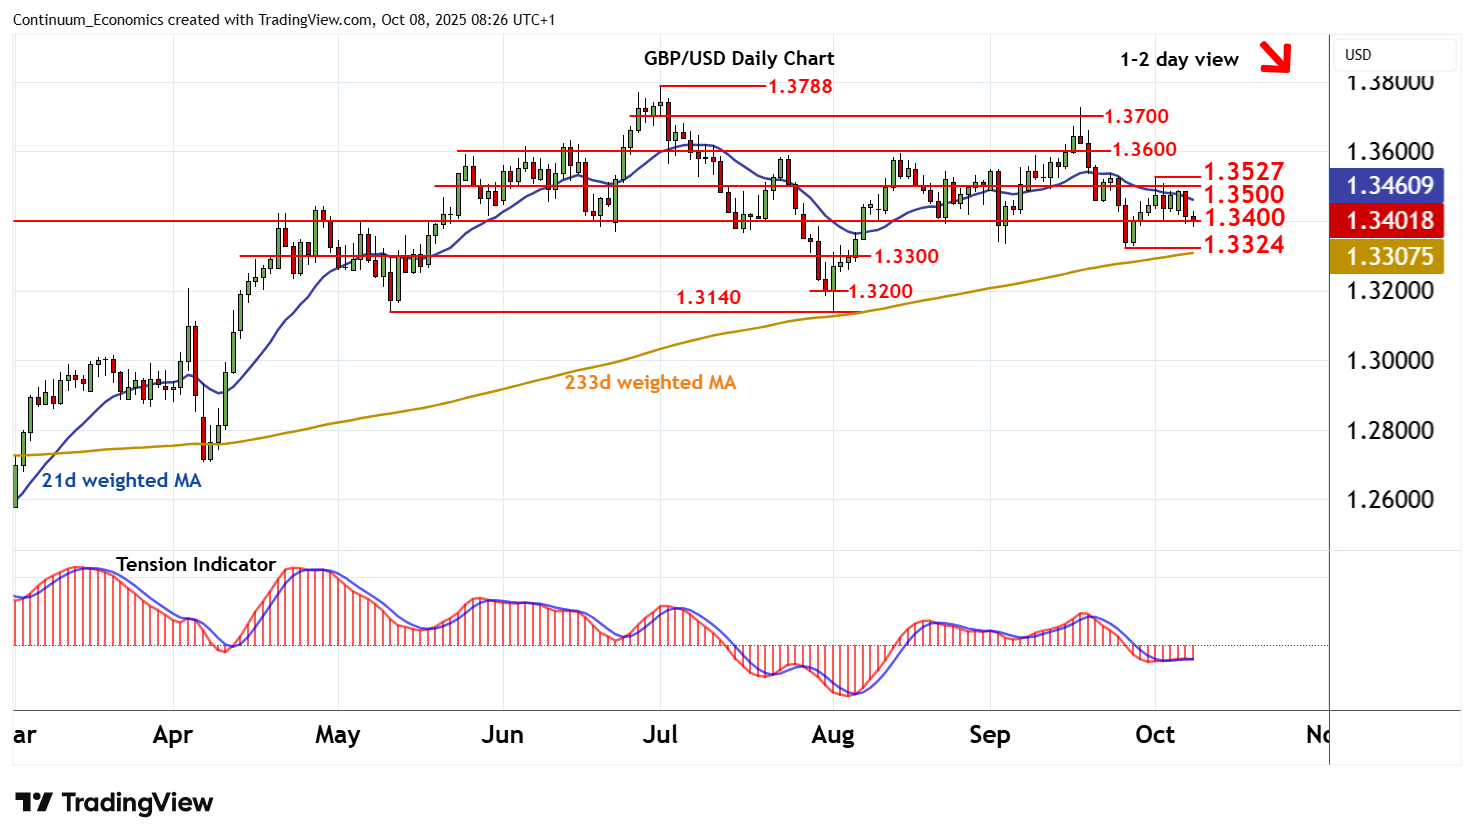
| R4 | 1.3700 | minor congestion | S1 | 1.3400 | * | congestion | ||
| R3 | 1.3600 | * | break level | S2 | 1.3324 | ** | 25 Sep (m) low | |
| R2 | 1.3527 | * | 1 Oct (w) high | S3 | 1.3300 | * | congestion | |
| R1 | 1.3500 | * | congestion | S4 | 1.3200 | * | congestion |
Asterisk denotes strength of level
08:10 BST - Cautious trade has given way to the anticipated test lower, with prices currently pressuring congestion support at 1.3400. Rising daily stochastics are flattening and the daily Tension Indicator is turning down, highlighting room for further losses in the coming sessions. A break beneath 1.3400 will open up the 1.3324 monthly low of 25 September. Broader weekly charts are also deteriorating. But a close beneath here is needed to turn sentiment negative and extend mid-September losses below 1.3300. Meanwhile, resistance remains at congestion around 1.3500 and extends to the 1.3527 weekly high of 1 October. This range should cap any immediate tests higher. A close above here, if seen, will improve price action and extend late-September gains towards resistance at 1.3600.