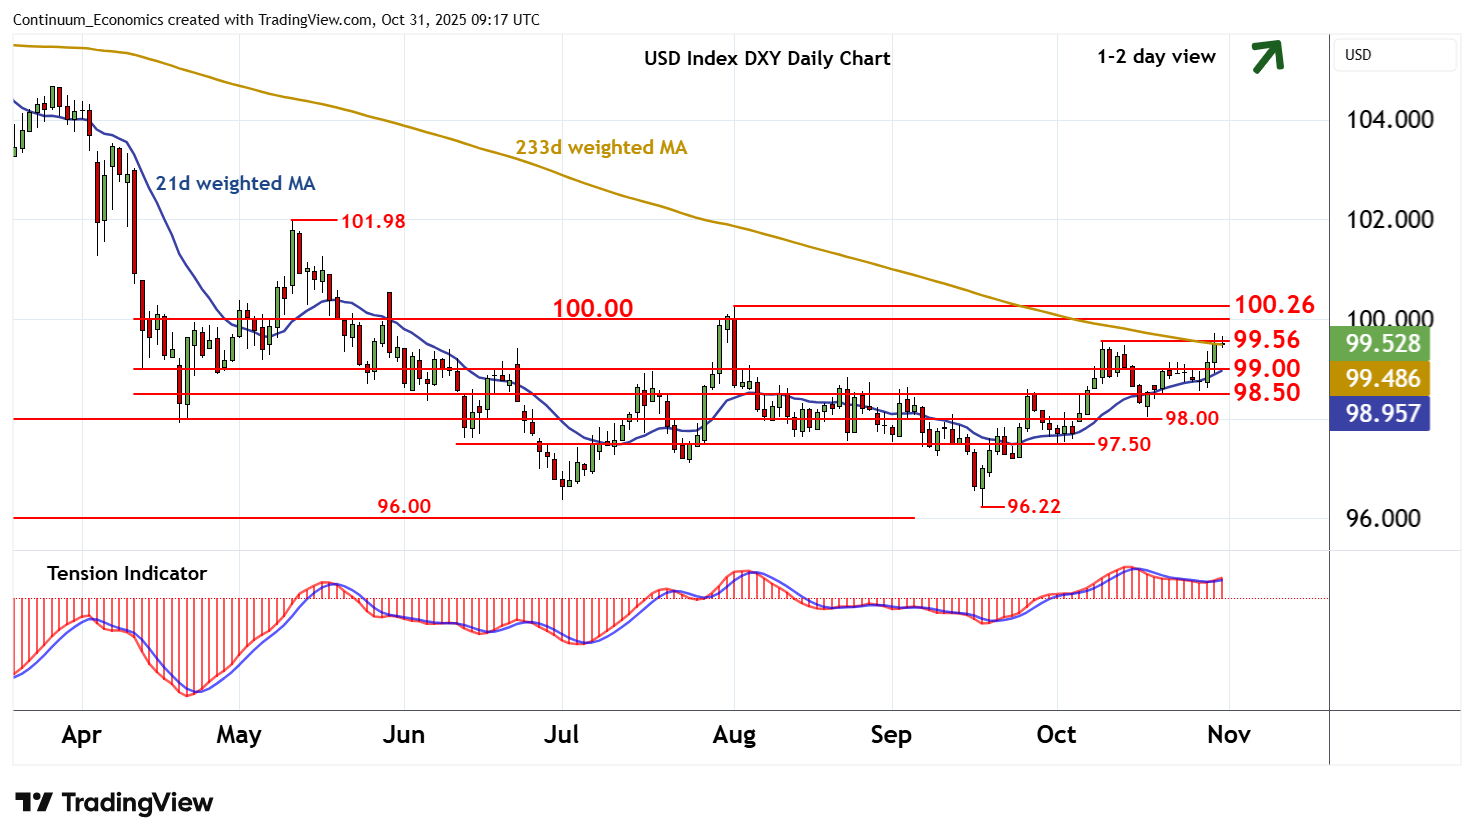
Chart USD Index DXY Update: Pressuring strong resistance - studies improving
The test above the 99.56 weekly high of 9 October has been pushed back from 99.72
| Levels | Imp | Comment | Levels | Imp | Comment | |||
|---|---|---|---|---|---|---|---|---|
| R4 | 100.26 | ** | 1 Aug (m) high | S1 | 99.00 | * | congestion | |
| R3 | 100.00 | ** | congestion | S2 | 98.50 | * | congestion | |
| R2 | 99.72 | *** | 30 Oct high | S3 | 98.00 | * | congestion | |
| R1 | 99.56 | ** | 9 Oct (w) high | S4 | 97.50 | * | congestion |
Asterisk denotes strength of level
09:00 GMT - The test above the 99.56 weekly high of 9 October has been pushed back from 99.72, as overbought intraday studies turn down, with prices currently balanced in cautious around 99.56. Daily readings continue to rise and the weekly Tension Indicator is also positive, highlighting room for fresh gains. But a close above 99.56 is needed to turn sentiment positive and extend mid-September gains towards 100.00/26, where flat overbought weekly stochastics could prompt fresh reactions. Meanwhile, a close below congestion support at 99.00 will stabilise price action and prompt consolidation above further congestion around 98.50.