Published: 2025-09-24T07:21:42.000Z
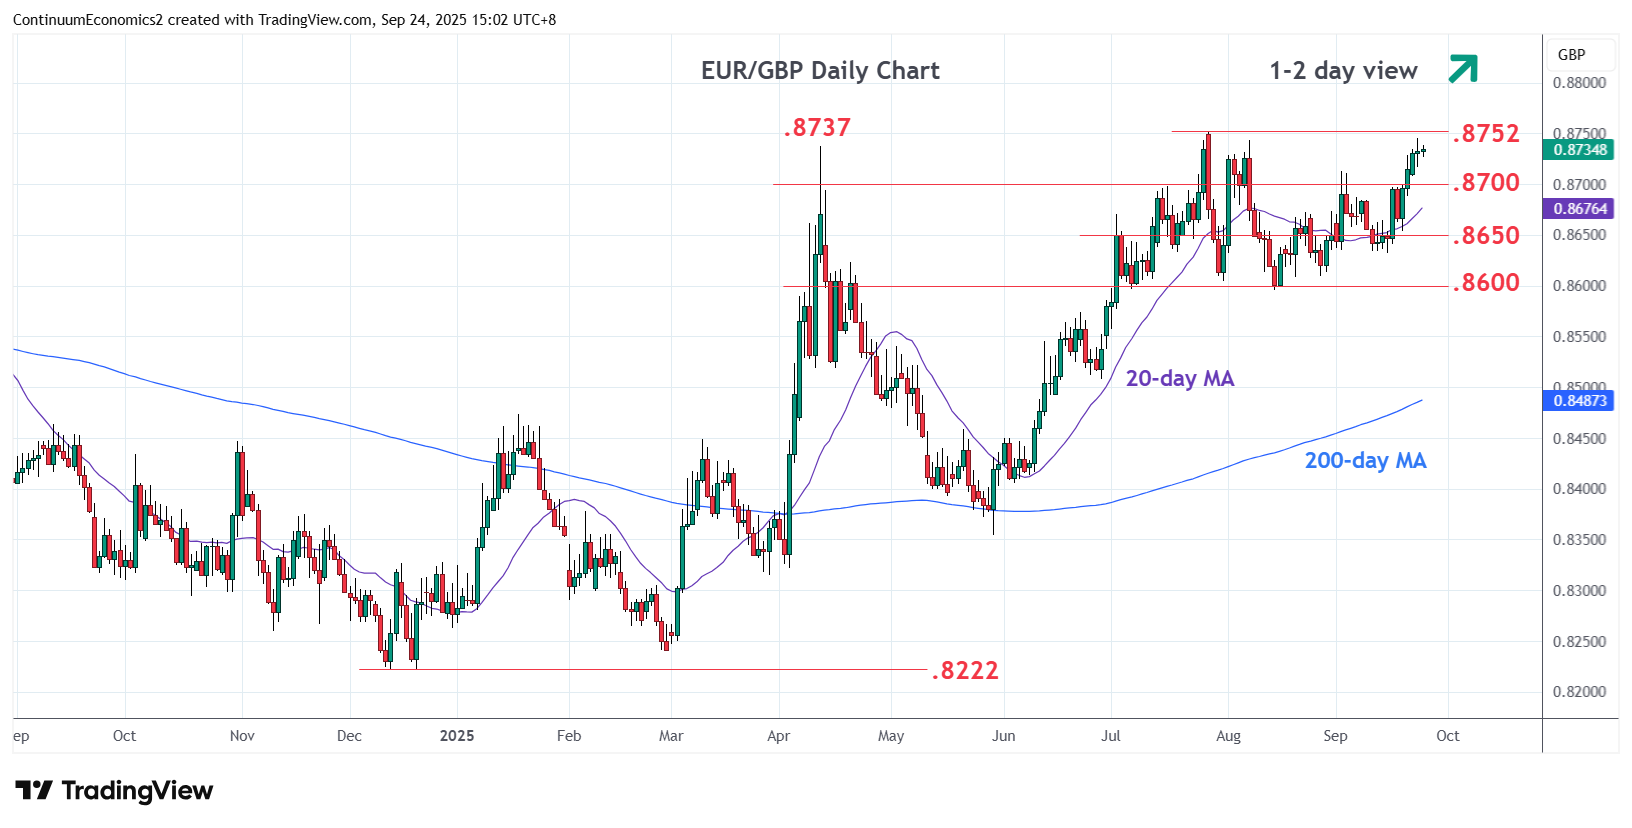
Chart EUR/GBP Update: Retest .8745/.8752, August/July highs
-
Break above the .8700 level see prices extending rally from the .8354 May low to retest the August/July highs at .8745/.8752
| Level | Comment | Level | Comment | |||||
|---|---|---|---|---|---|---|---|---|
| R4 | 0.8875 | * | 61.8% 2022/2024 fall | S1 | 0.8700 | * | congestion | |
| R3 | 0.8800 | * | figure, congestion | S2 | 0.8650 | * | congestion | |
| R2 | 0.8765 | ** | Nov 2023 high | S3 | 0.8632 | * | 15 Sep low | |
| R1 | 0.8752 | ** | 28 Jul YTD high, 50% | S4 | 0.8600 | ** | congestion, Aug low |
Asterisk denotes strength of level
07:15 GMT - Break above the .8700 level see prices extending rally from the .8354 May low to retest the .8745/.8752 August/July highs. This is also 50% Fibonacci level and reaction here can be expected though a later break here cannot be ruled out to further retrace 2022/2024 losses. Break will open up room for extension to the .8800 level. Meanwhile, support is raised to .8700/.8688 area which should underpin. Break here will fade the upside pressure and see room for deeper pullback to support at .8650/.8632 congestion and 15 Sep low.