Published: 2025-08-01T11:41:18.000Z
Chart USD/ZAR Update: July gains approaching the 18.4100 Fibonacci retracement

Senior Technical Strategist
-
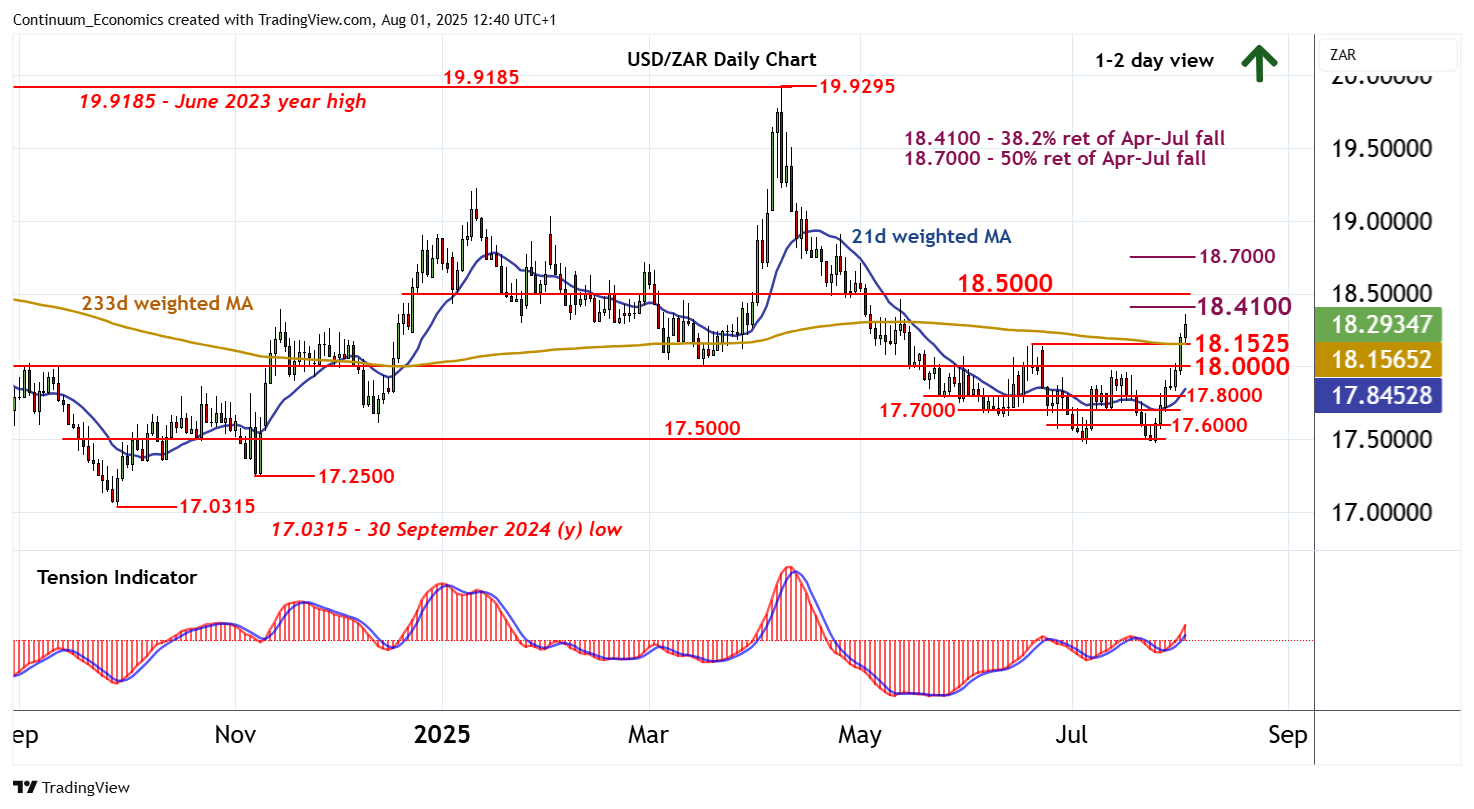
The anticipated break above the 18.1525 monthly high of 19 June has reached 18.3575
| Level | Comment | Level | Comment | |||||
|---|---|---|---|---|---|---|---|---|
| R4 | 18.9000 | * | congestion | S1 | 18.1525 | ** | 19 Jun (m) high | |
| R3 | 18.7000 | ** | 50% ret of Apr-Jul fall | S2 | 18.0000 | ** | congestion | |
| R2 | 18.5000 | ** | break level | S3 | 17.8000 | * | congestion | |
| R1 | 18.4100~ | ** | 38.2% ret of Apr-Jul fall | S4 | 17.7000 | * | congestion |
Asterisk denotes strength of level
12:30 BST - The anticipated break above the 18.1525 monthly high of 19 June has reached 18.3575, where overbought intraday and daily stochastics are prompting short-term reactions. The daily Tension Indicator continues to rise and broader weekly charts are positive, highlighting room for still further gains in the coming sessions towards strong resistance at the 18.4100~ Fibonacci retracement. Initial tests could give way to consolidation, before July gains extends towards 18.5000. Meanwhile, a close back below 18.1525, if seen, will turn sentiment cautious and prompt consolidation above congestion around 18.0000.