Published: 2025-04-23T12:36:06.000Z
Chart USD/ZAR Update: Consolidating test of strong support - studies under pressure

Senior Technical Strategist
-
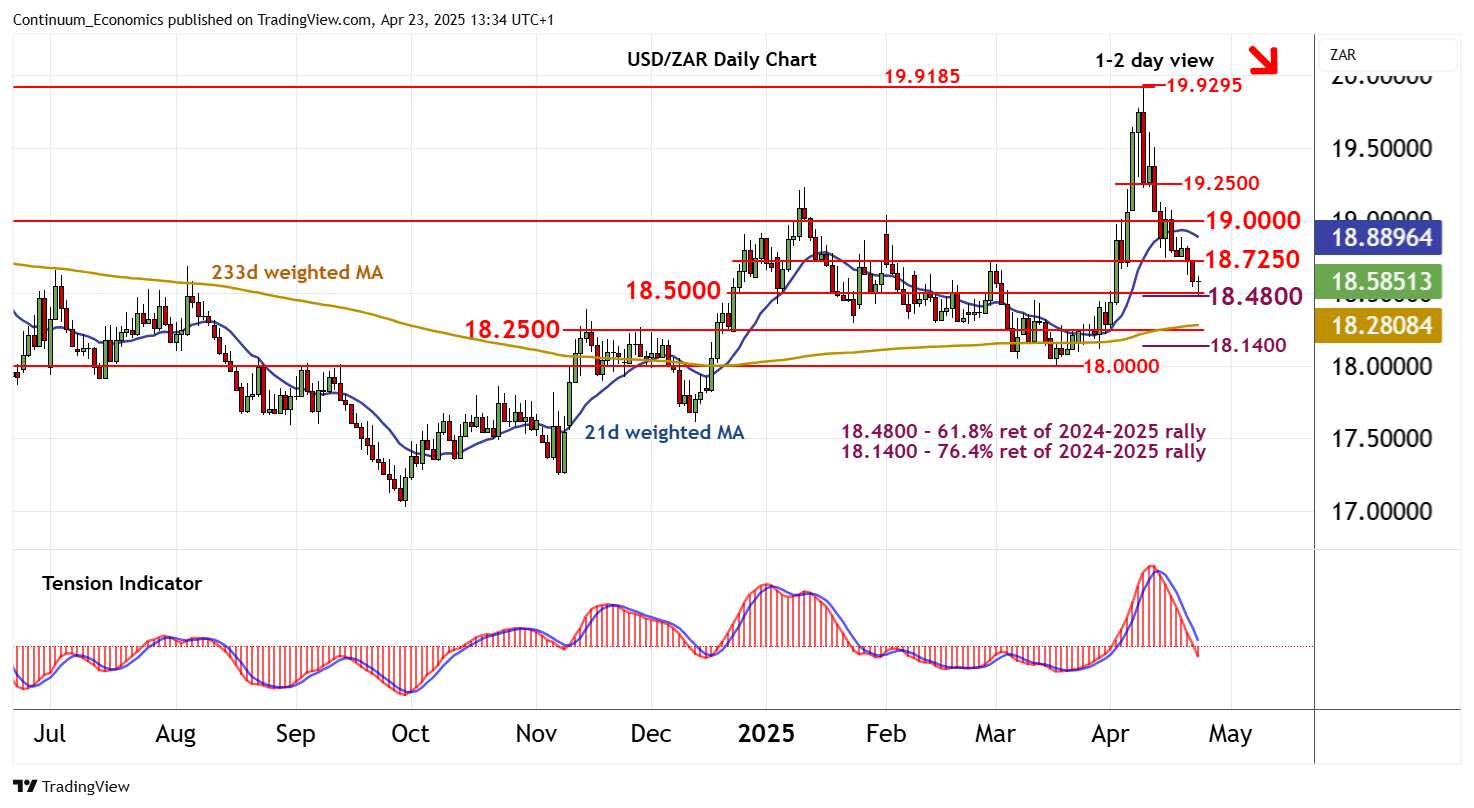
Anticipated losses have reached support at the 18.4800 Fibonacci retracement and the 18.5000 break level
| Level | Comment | Level | Comment | |||||
|---|---|---|---|---|---|---|---|---|
| R4 | 19.5000 | congestion | S1 | 18.5000 | ** | break level | ||
| R3 | 19.2500 | break level | S2 | 18.4800 | ** | 61.8% ret of 2024-2025 rally | ||
| R2 | 19.0000 | ** | congestion | S3 | 18.2500 | * | congestion | |
| R1 | 18.7250 | * | congestion | S4 | 18.1400 | ** | 76.4% ret of 2024-2025 rally |
Asterisk denotes strength of level
13:20 BST - Anticipated losses have reached support at the 18.4800 Fibonacci retracement and the 18.5000 break level. Intraday studies are unwinding oversold areas and daily stochastics are also flat in oversold areas, suggesting potential for a minor bounce. However, the negative daily Tension Indicator and bearish weekly charts are expected to limit scope in renewed selling interest beneath congestion resistance at 18.7250. Following any cautious trade, fresh losses are looked for. A close below 18.4800 - 18.5000 will add weight to sentiment and extend April losses towards congestion around 18.2500.