Chart USD/CHF Update: Pressuring resistance - background studies rising
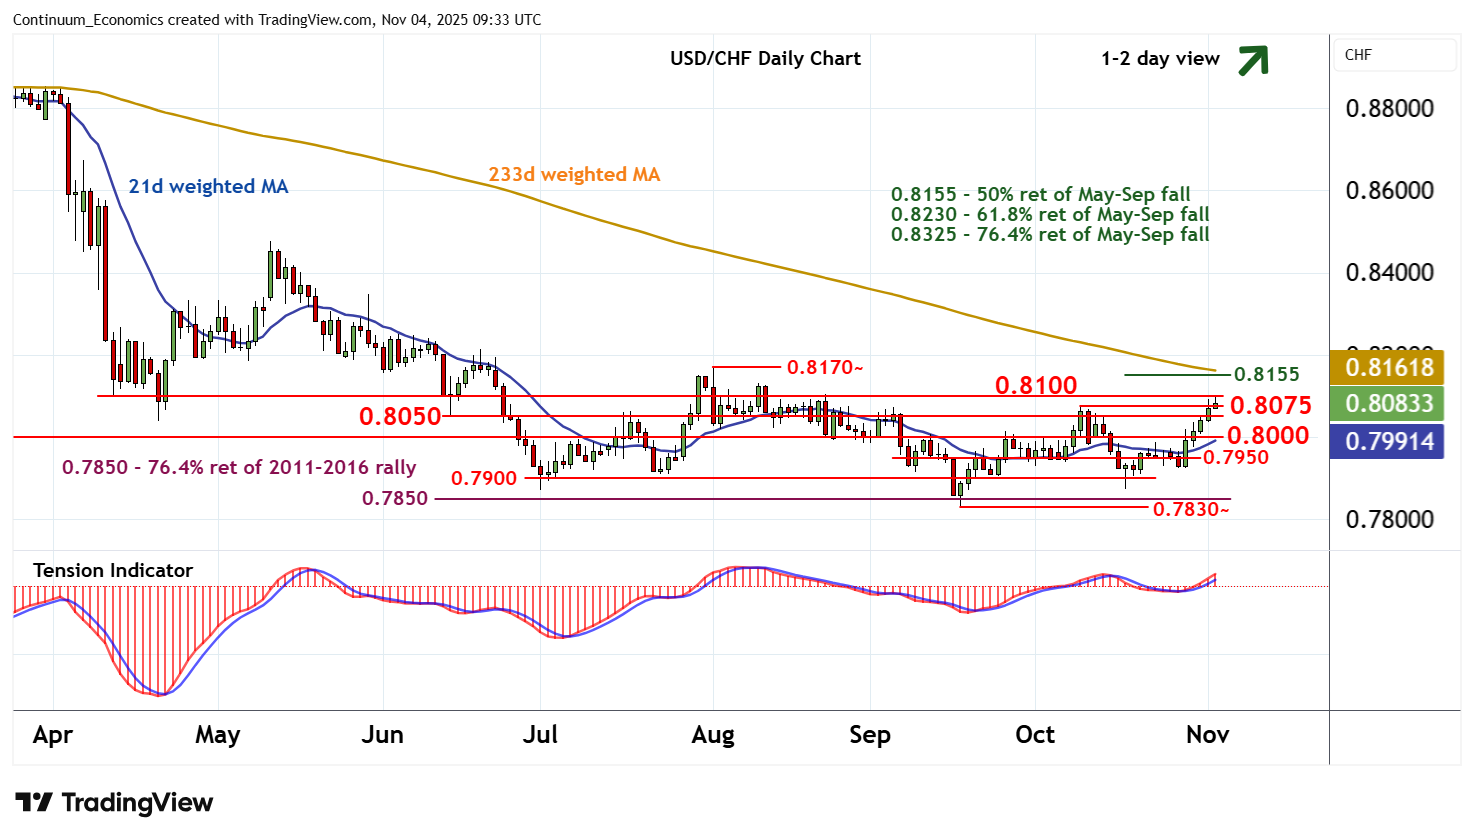
The test of resistance at the 0.8075 weekly high of 9 October has given way to a break towards 0.8100
| Level | Comment | Level | Comment | |||||
|---|---|---|---|---|---|---|---|---|
| R4 | 0.8170~ | ** | 1 Aug (m) range high | S1 | 0.8050 | break level | ||
| R3 | 0.8155 | ** | 50% ret of May-Sep fall | S2 | 0.8000 | ** | congestion | |
| R2 | 0.8100 | ** | break level | S3 | 0.7950 | * | recent lows | |
| R1 | 0.8075 | * | 9 Oct (w) high | S4 | 0.7900 | congestion |
Asterisk denotes strength of level
09:20 GMT - The test of resistance at the 0.8075 weekly high of 9 October has given way to a break towards 0.8100, where deteriorating intraday studies and flat overbought daily stochastics are prompting a pullback to 0.8075. The daily Tension Indicator continues to rise and broader weekly charts are positive, highlighting room for further strength in the coming sessions A close above 0.8075 will improve sentiment and extend mid-September gains beyond 0.8100 towards strong resistance within the 0.8155 Fibonacci retracement and the 0.8170~ monthly range high of 1 August. But already overbought daily stochastics should limit any initial tests of this range in consolidation. Meanwhile, a close back below 0.8050 will turn sentiment neutral and prompt consolidation above congestion support around 0.8000.