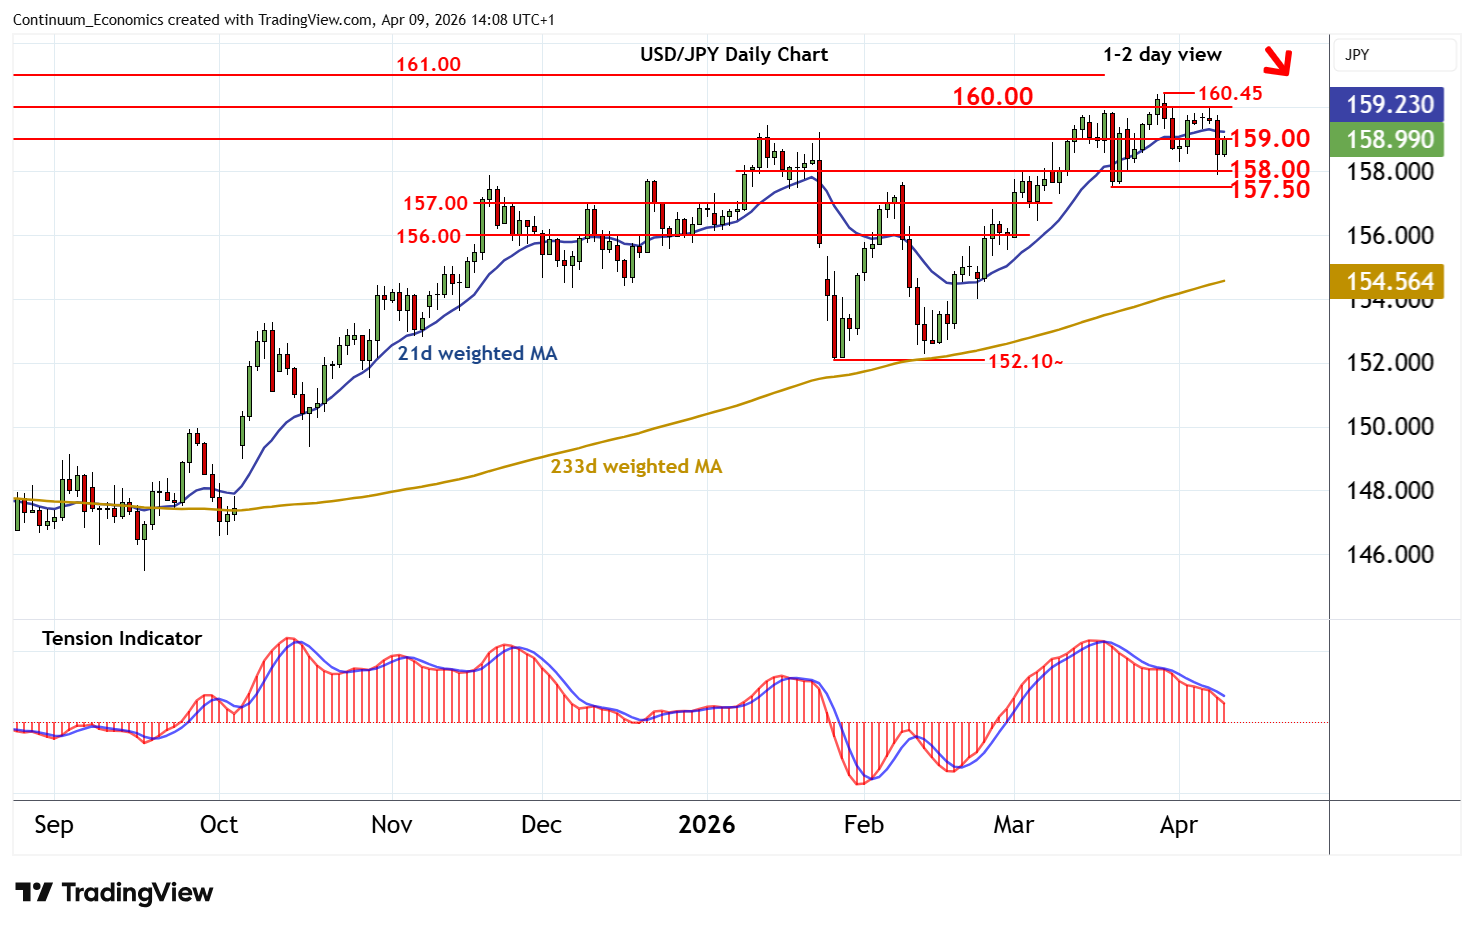
Chart USD/JPY Update: Gains to remain limited
The test of support at 158.00 has given way to a bounce
| Levels | Imp | Comment | Levels | Imp | Comment | |||
|---|---|---|---|---|---|---|---|---|
| R4 | 161.00 | July 2024 congestion | S1 | 158.00 | * | break level | ||
| R3 | 160.45 | ** | 30 Mar YTD high | S2 | 157.35/50 | ** | 38.2% ret; 19 Mar (w) low | |
| R2 | 160.00 | ** | historic congestion | S3 | 157.00 | * | congestion | |
| R1 | 159.00 | * | congestion | S4 | 156.35 | * | 50% ret of Feb-Mar rally |
Asterisk denotes strength of level
13:30 BST - The test of support at 158.00 has given way to a bounce, as oversold intraday studies unwind, with prices currently pressuring congestion resistance at 159.00. A test above here cannot be ruled out. But negative daily readings and mixed/negative weekly charts should limit scope in renewed selling interest beneath 160.00. Following cautious/corrective trade, fresh losses are looked for. Support remains at 158.00. But a close below the 157.50 weekly low of 19 March will add weight to sentiment and confirm a near-term top in place at the 160.45 current year high of 30 March, as focus then turns to the 157.35 Fibonacci retracement, ahead of congestion around 157.00.