Published: 2026-02-23T14:10:33.000Z
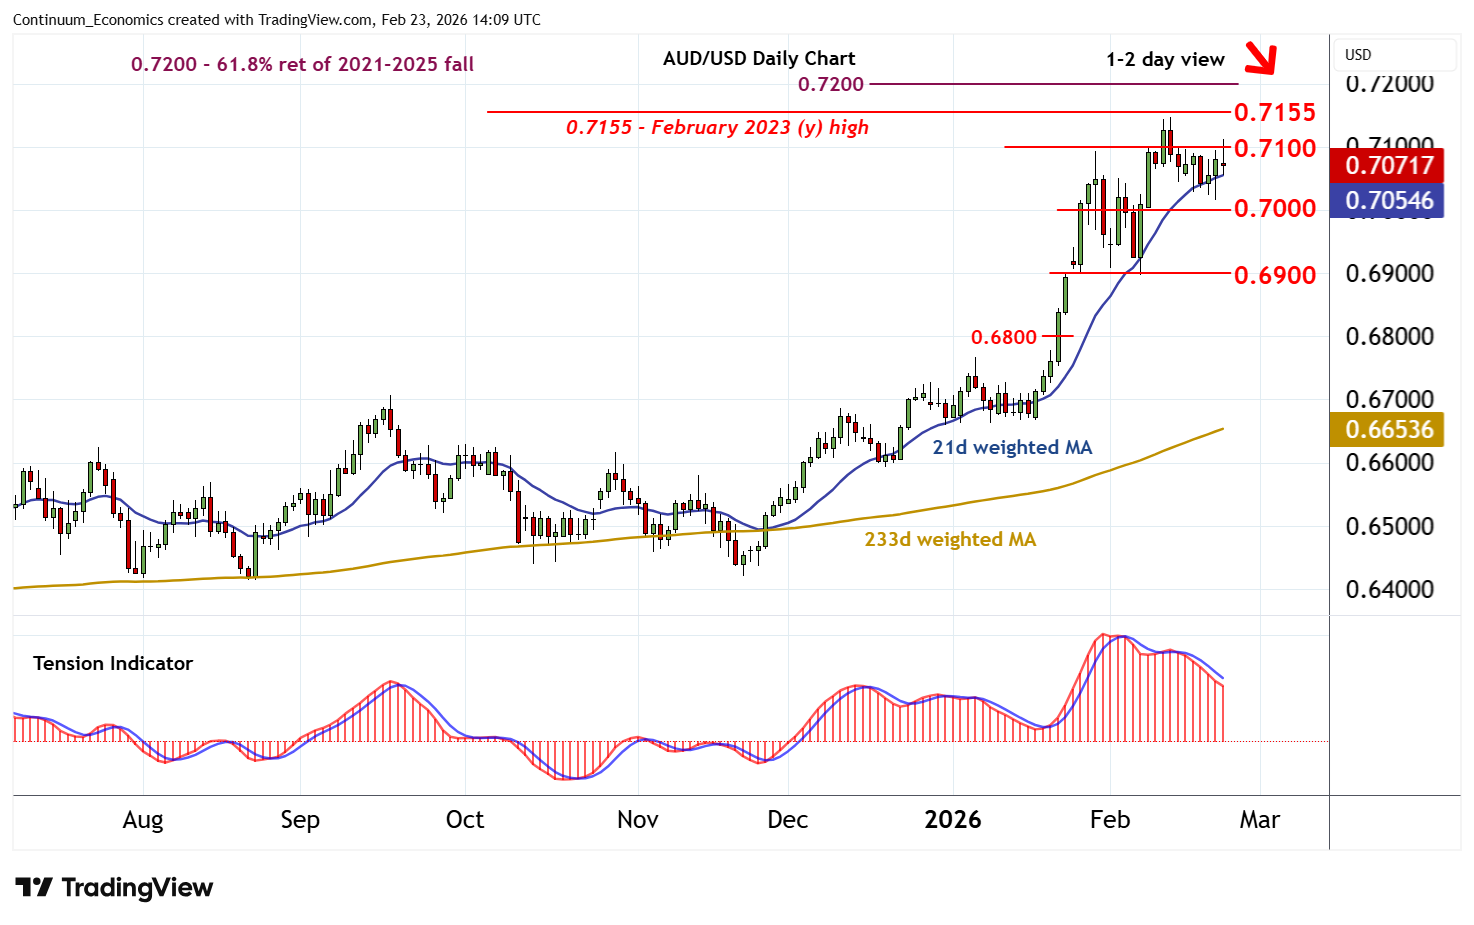
Chart AUD/USD Update: Range extension
-
Little change, as prices extend consolidation following the test of resistance at 0.7100
| Levels | Imp | Comment | Levels | Imp | Comment | |||
|---|---|---|---|---|---|---|---|---|
| R4 | 0.7280~ | ** | June 2022 high | S1 | 0.7000 | * | congestion | |
| R3 | 0.7200 | ** | 61.8% ret of 2021-2025 fall | S2 | 0.6900 | ** | break level | |
| R2 | 0.7147/55~ | ** | 12 Feb YTD high; Feb 2023 (y) high | S3 | 0.6800 | break level | ||
| R1 | 0.7100 | break level | S4 | 0.6700 | * | break level |
Asterisk denotes strength of level
14:00 GMT - Little change, as prices extend consolidation following the test of resistance at 0.7100. Oversold daily stochastics are rising, suggesting room for a retest above here. But the bearish daily Tension Indicator and a tick lower in overbought weekly stochastics should limit scope in selling interest beneath strong resistance at 0.7147/55~. Meanwhile, support remains at congestion around 0.7000. But the rising weekly Tension Indicator and positive longer-term charts should limit any tests in buying interest/consolidation.