Chart USD Index DXY Update: Consolidating - room for a test higher
The anticipated test below congestion support at 99.00 has bounced from 98.95~
| Levels | Imp | Comment | Levels | Imp | Comment | |||
|---|---|---|---|---|---|---|---|---|
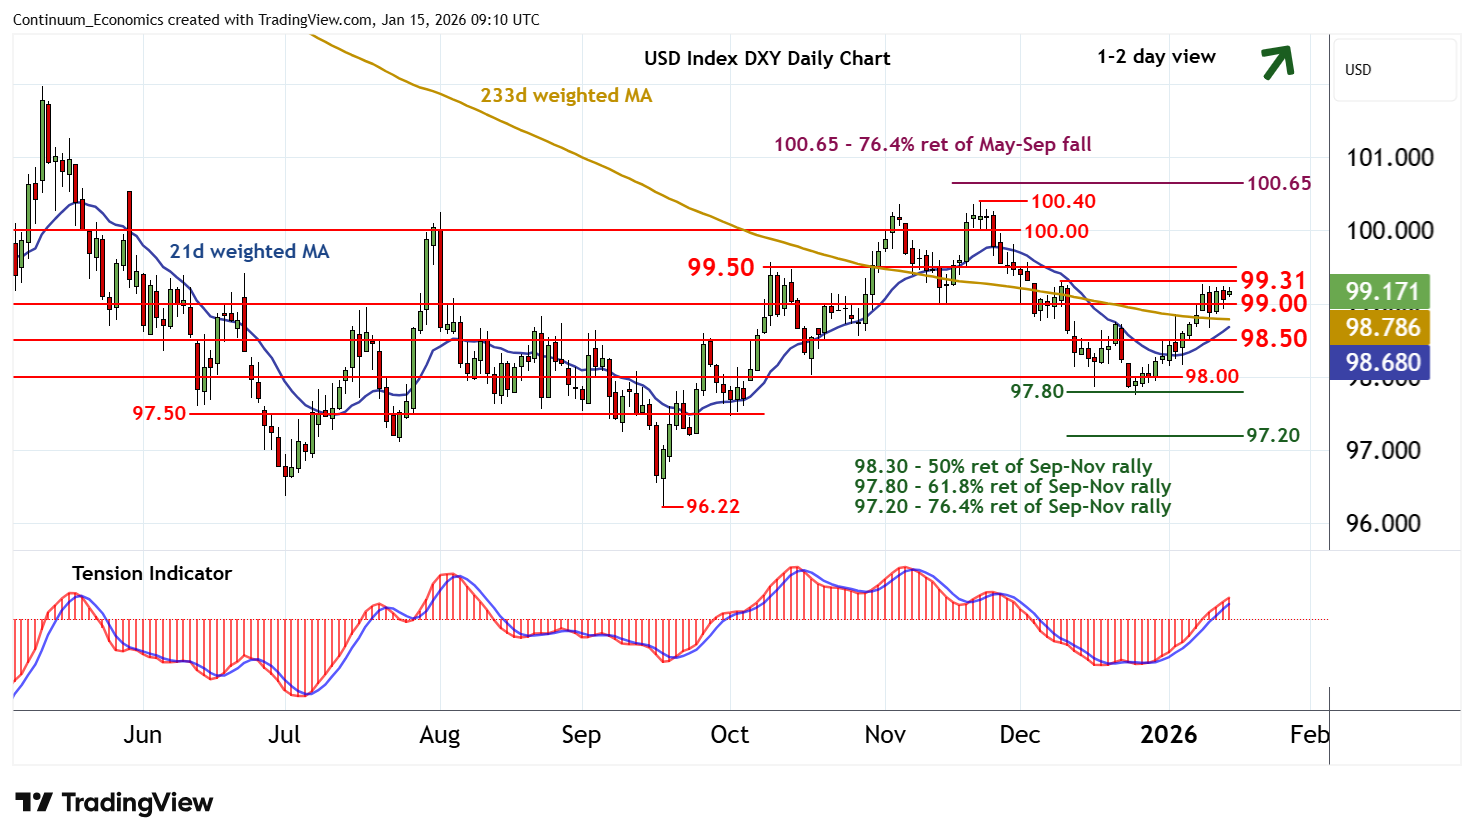
| R4 | 100.40 | ** | 21 Nov (m) high | S1 | 99.00 | * | congestion | |
| R3 | 100.00 | ** | congestion | S2 | 98.50 | * | congestion | |
| R2 | 99.50 | * | break level | S3 | 98.00 | * | congestion | |
| R1 | 99.26/31 | * | 9 Jan; 9 Dec (w) highs | S4 | 97.80 | ** | 61.8% ret of Sep-Nov rally |
Asterisk denotes strength of level
08:55 GMT - The anticipated test below congestion support at 99.00 has bounced from 98.95~, with prices currently trading around 99.15. Overbought daily stochastics have ticked higher and the daily Tension Indicator continues to rise, highlighting room for a test of strong resistance at the 99.26/31 weekly highs from 9 December - 9 January. A tick higher in weekly stochastics points to room for a break above here towards 99.50. But the flat weekly Tension Indicator and negative longer-term charts should limit any further strength in renewed selling interest towards 100.00. Meanwhile, support remains at 99.00. A close beneath here would help to stabilise price action and give way to consolidation above further congestion around 98.50.