Published: 2026-03-24T01:59:00.000Z
Chart GBP/USD Update: Still limited above the 200-day MA
1
Still limited on break above the 200-day MA at 1.3435 following rejection from 1.3480 high
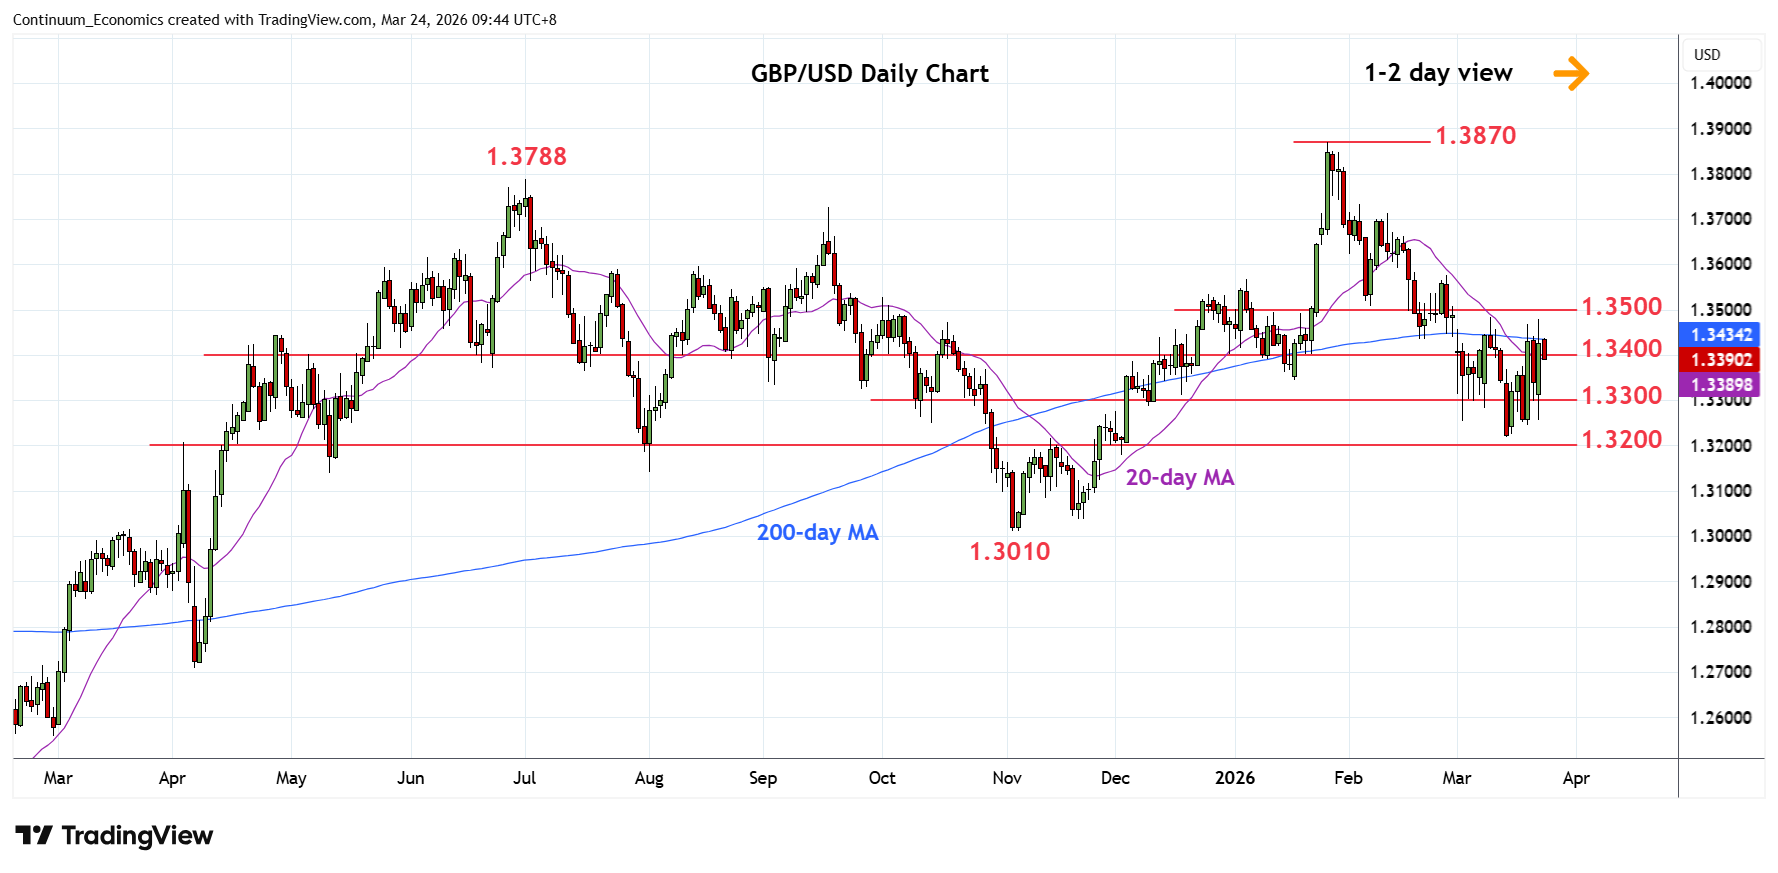
| Level | Comment | Level | Comment | |||||
|---|---|---|---|---|---|---|---|---|
| R4 | 1.3600 | * | congestion | S1 | 1.3300 | * | congestion | |
| R3 | 1.3575 | * | 26 Feb high | S2 | 1.3250 | * | congestion | |
| R2 | 1.3500/10 | ** | congestion, 6 Feb low | S3 | 1.3213 | ** | 13 Mar YTD low | |
| R1 | 1.3435 | * | 200-day MA | S4 | 1.3200 | * | congestion |
Asterisk denotes strength of level
01:50 GMT - Still limited on break above the 200-day MA at 1.3435 following rejection from 1.3480 high. However, positive daily studies see choppy trade tracing out a potential 3-week bottom pattern from the 1.3213 low and close above the 200-day MA will open up room for stronger gains to strong resistance at 1.3500/10 area. Clearance here will return focus to the upside and see room to the 1.3600 level. Meanwhile, support remains at the 1.3300 congestion which should underpin and sustain bounce from the 1.3213, 13 March current year low.