Published: 2026-01-29T07:36:18.000Z
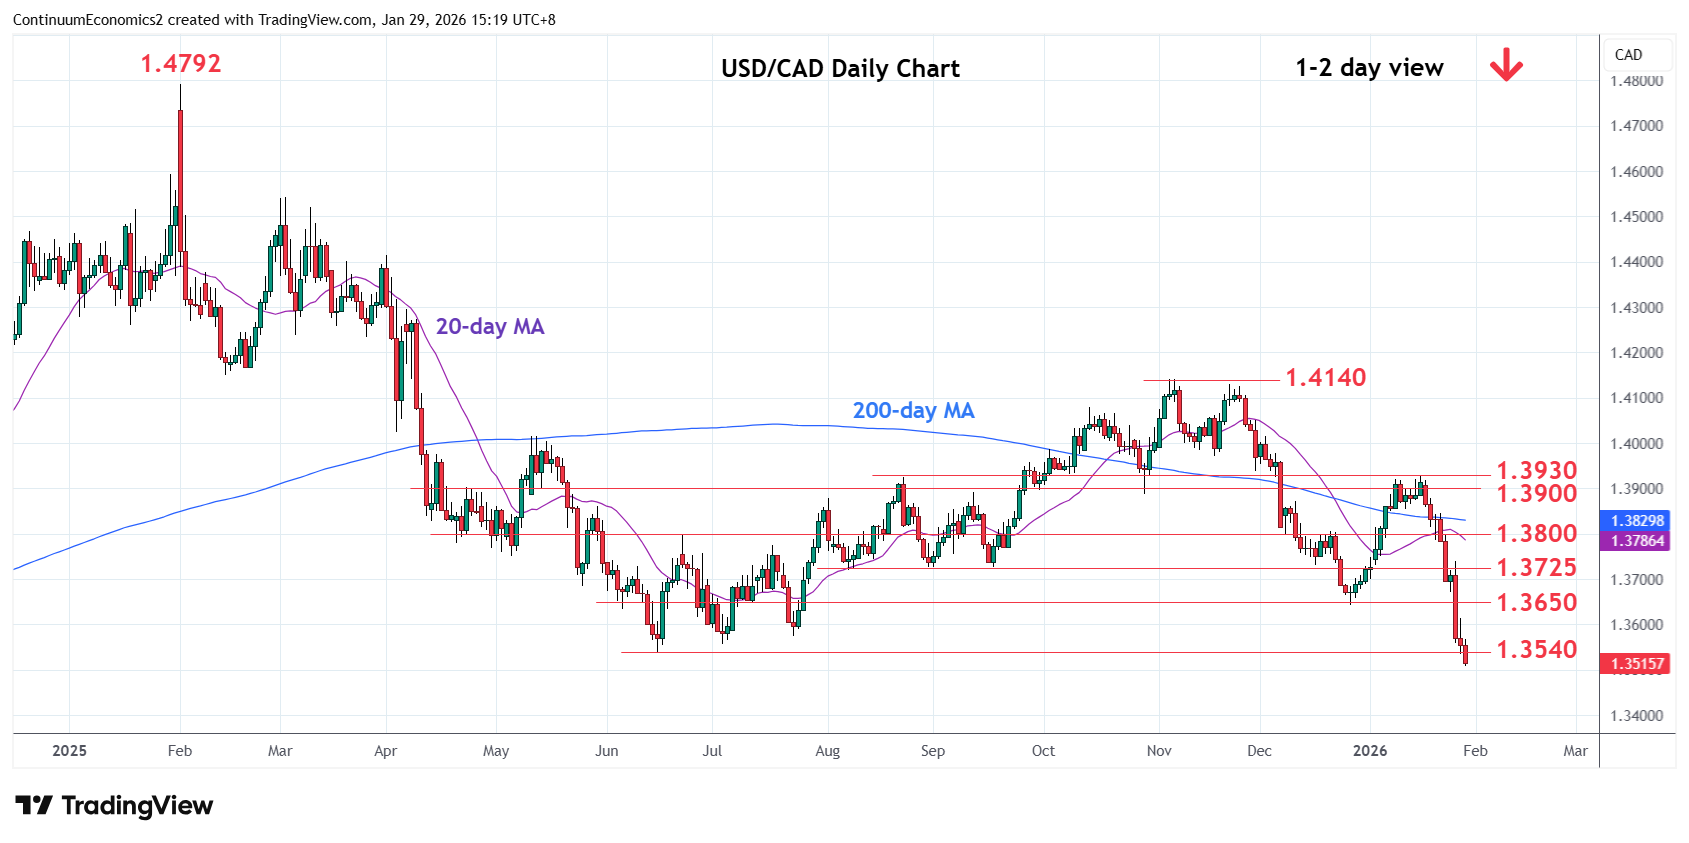
Chart USD/CAD Update: Extending losses
2
Break of the June 2025 year low at 1.3540 see prices extending the broader losses from the February 2025 year high
| Levels | Imp | Comment | Levels | Imp | Comment | |||
|---|---|---|---|---|---|---|---|---|
| R4 | 1.3800 | * | congestion, 23 Jan high | S1 | 1.3500 | * | congestion | |
| R3 | 1.3725 | * | congestion, Aug/Sep low | S2 | 1.3420/00 | * | Sep 2024 low, 50% | |
| R2 | 1.3650 | ** | Dec low | S3 | 1.3350 | * | congestion | |
| R1 | 1.3600 | congestion | S4 | 1.3300 | * | congestion |
Asterisk denotes strength of level
07:30 GMT - Break of the June 2025 year low at 1.3540 see prices extending the broader losses from the February 2025 year high. Negative daily and weekly studies keep pressure on the downside and suggest room to further retrace gains from the 2021 year low to the 1.3500 level. Lower still, will see extension to the 1.3420/00 support and 50% Fibonacci level. Meanwhile, resistance is lowered to the 1.3600/50 congestion and December low which is expected to cap. Only above here will see room for stronger corrective bounce to retrace losses from the 1.3930, 16 January swing high.