Published: 2025-04-07T11:58:21.000Z
Chart GBP/USD Update: Fresh selling pressure

Senior Technical Strategist
1
Cautious trade around 1.2900 has given way to anticipated losses
| Level | Comment | Level | Comment | |||||
|---|---|---|---|---|---|---|---|---|
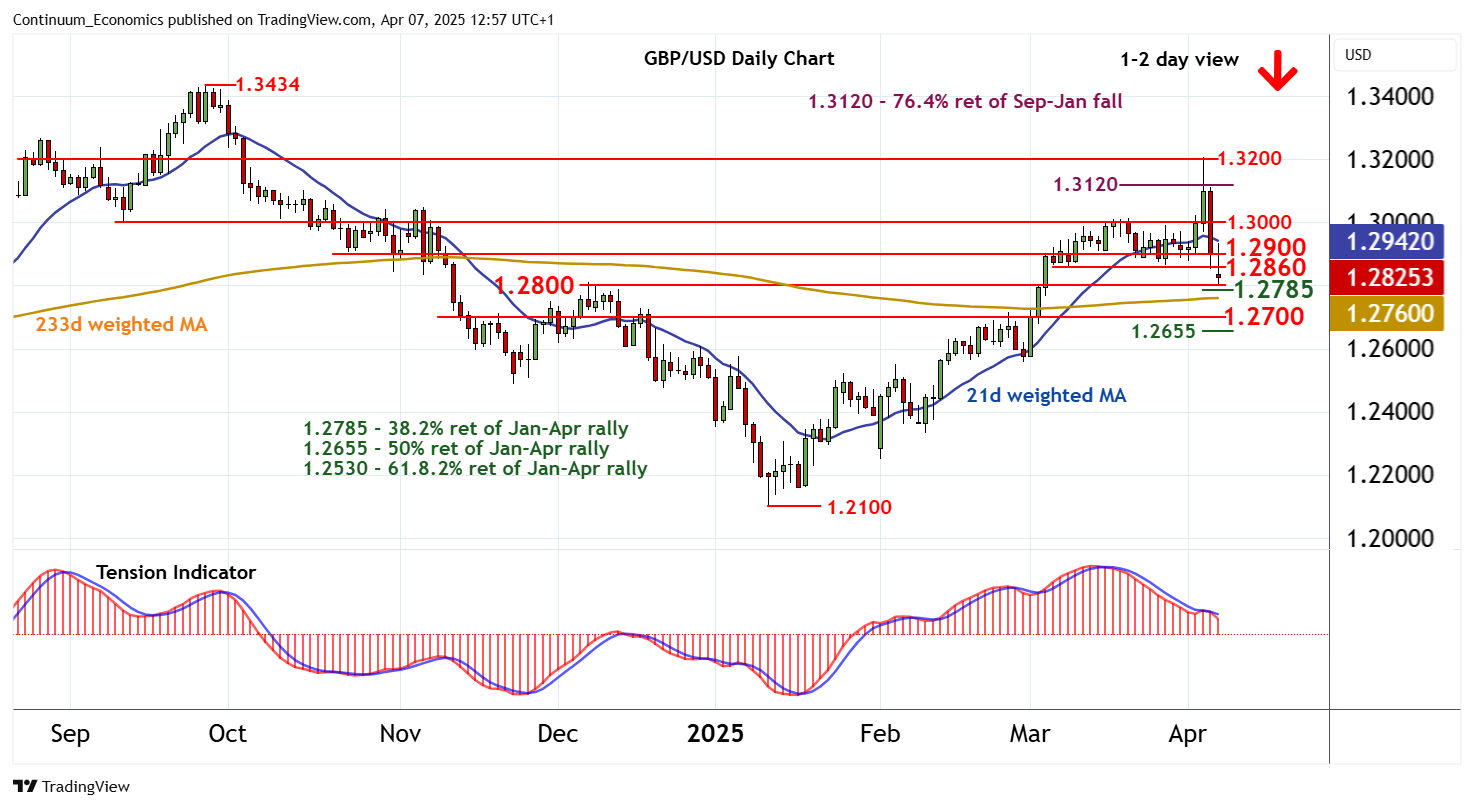
| R4 | 1.3100/20 | * | cong; 76.4% ret of Sep-Jan fall | S1 | 1.2800 | ** | congestion | |
| R3 | 1.3000 | ** | range highs | S2 | 1.2785 | ** | 38.2% ret of Jan-Apr rally | |
| R2 | 1.2900 | ** | congestion | S3 | 1.2700 | congestion | ||
| R1 | 1.2860 | * | 6-10 Mar lows | S4 | 1.2655 | ** | 50% ret of Jan-Apr rally |
Asterisk denotes strength of level
12:50 BST - Cautious trade around 1.2900 has given way to anticipated losses, as intraday studies continue to track lower, with fresh selling interest extending April losses towards strong support at the 1.2785 Fibonacci retracement and congestion around 1.2800. Daily readings have ticked down once again and broader weekly charts are coming under pressure, highlighting room for a break and continuation down to congestion around 1.2700. Meanwhile, resistance is lowered to the 1.2860 lows from 6-10 March and extends to congestion around 1.2900. A close above this range would help to stabilise price action and prompt consolidation beneath 1.3000.