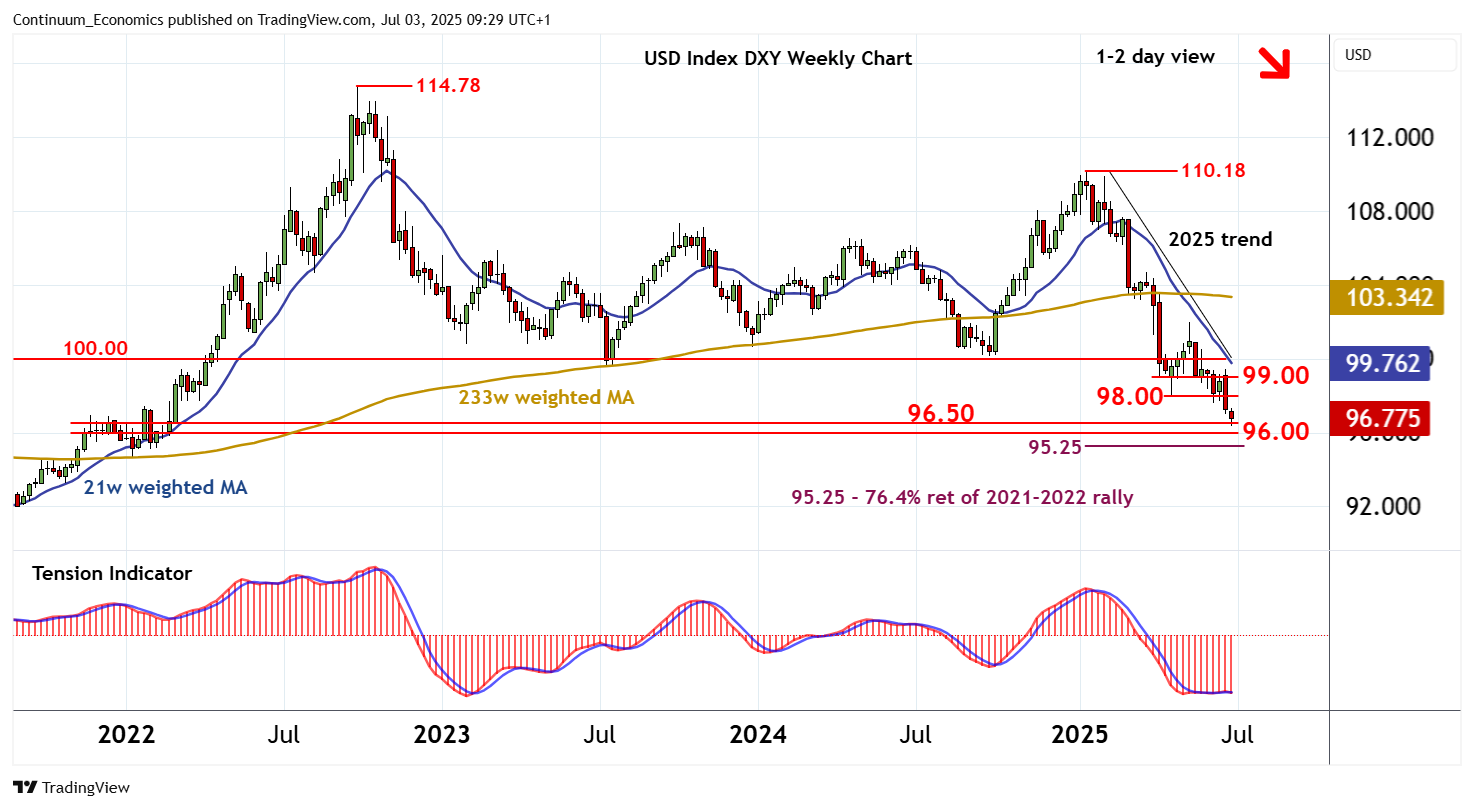
Chart USD Index DXY Update: Balanced above 2025 year lows

The anticipated break below 96.50 has posted a fresh year low at 96.38
| Levels | Imp | Comment | Levels | Imp | Comment | |||
|---|---|---|---|---|---|---|---|---|
| R4 | 99.50 | congestion | S1 | 96.50 | * | congestion | ||
| R3 | 99.00 | break level | S2 | 96.38 | * | 1 Jul YTD low | ||
| R2 | 98.00 | * | congestion | S3 | 96.00 | ** | congestion | |
| R1 | 97.60 | * | 12 Jun (w) low | S4 | 95.25 | ** | 76.4% ret of 2021-2022 rally |
Asterisk denotes strength of level
09:10 BST - The anticipated break below 96.50 has posted a fresh year low at 96.38, before settling into consolidation above 96.50 as oversold daily stochastics flatten. In the coming sessions, cautious trade is highlighted, before the bearish daily Tension Indicator and negative weekly charts prompt renewed selling. A later break back below 96.50 will open up further congestion around 96.00, with room for extension of September 2022 losses towards the 95.25 Fibonacci retracement. Meanwhile, resistance remains at congestion around 98.00. A close above here, if seen, will help to stabilise price action and prompt consolidation beneath 99.00.