Published: 2025-07-18T15:20:35.000Z
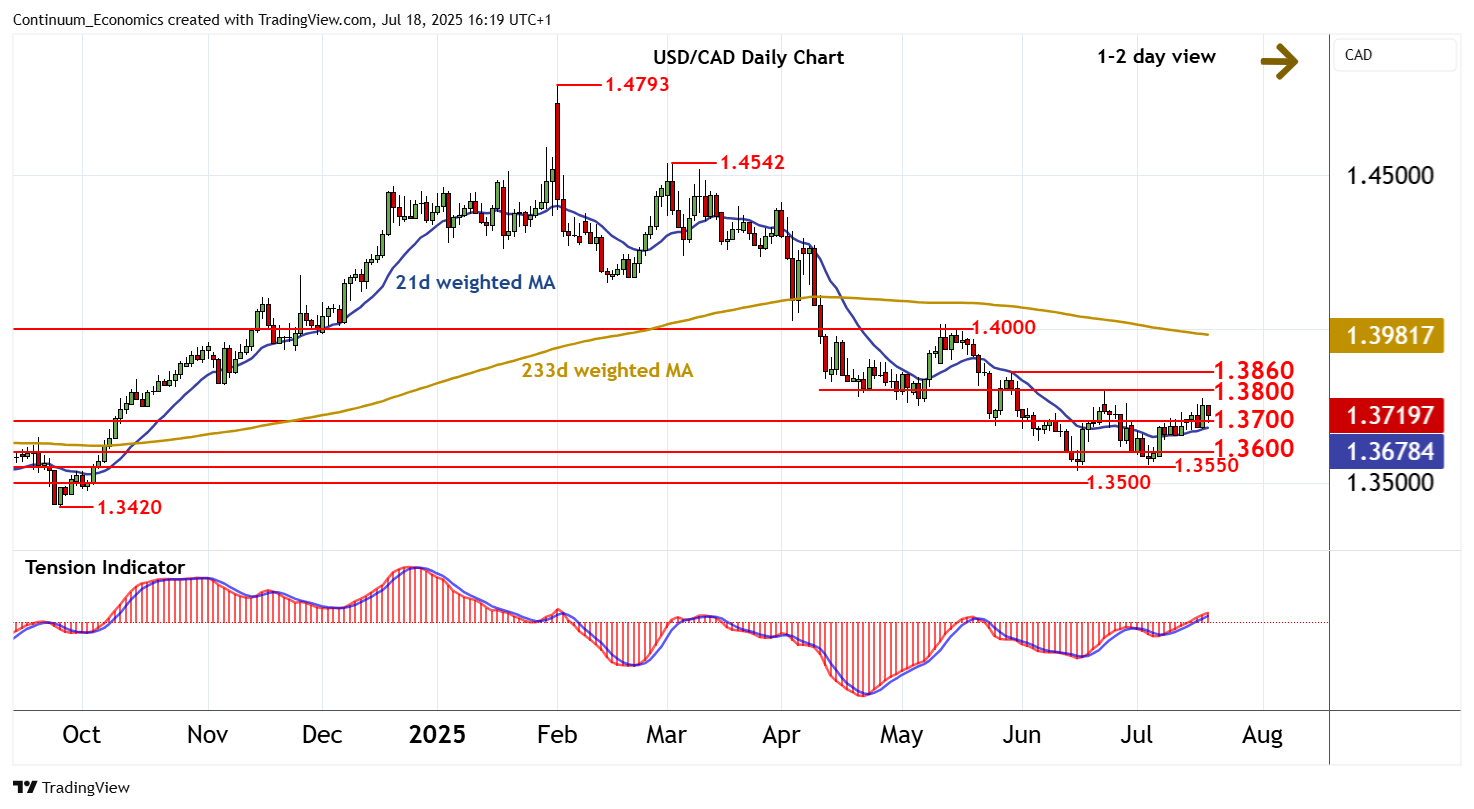
Chart USD/CAD Update: Potential for a test below 1.3700

Senior Technical Strategist
4
The anticipated test above 1.3750 has been pushed back from 1.3775
| Levels | Imp | Comment | Levels | Imp | Comment | |||
|---|---|---|---|---|---|---|---|---|
| R4 | 1.4000 | ** | break level | S1 | 1.3700 | ** | congestion | |
| R3 | 1.3900 | * | break level | S2 | 1.3600 | ** | congestion | |
| R2 | 1.3860 | * | 29 May (w) high | S3 | 1.3550 | * | congestion | |
| R1 | 1.3800 | * | congestion | S4 | 1.3500 | * | congestion |
Asterisk denotes strength of level
16:10 BST - The anticipated test above 1.3750 has been pushed back from 1.3775, as intraday studies turn down, with prices currently consolidating the test of congestion support at 1.3700. Overbought daily stochastics are also unwinding, suggesting potential for a test beneath here. But the rising daily Tension Indicator positive weekly charts should limit scope in renewed buying interest towards further congestion around 1.3600. Meanwhile, resistance remains at congestion around 1.3800. A close above here, not yet seen, will turn sentiment positive and extend June gains towards the 1.3860 weekly high of 29 May.