Published: 2025-04-24T07:32:41.000Z
Chart GBP/USD Update: Daily studies under pressure

Senior Technical Strategist
-
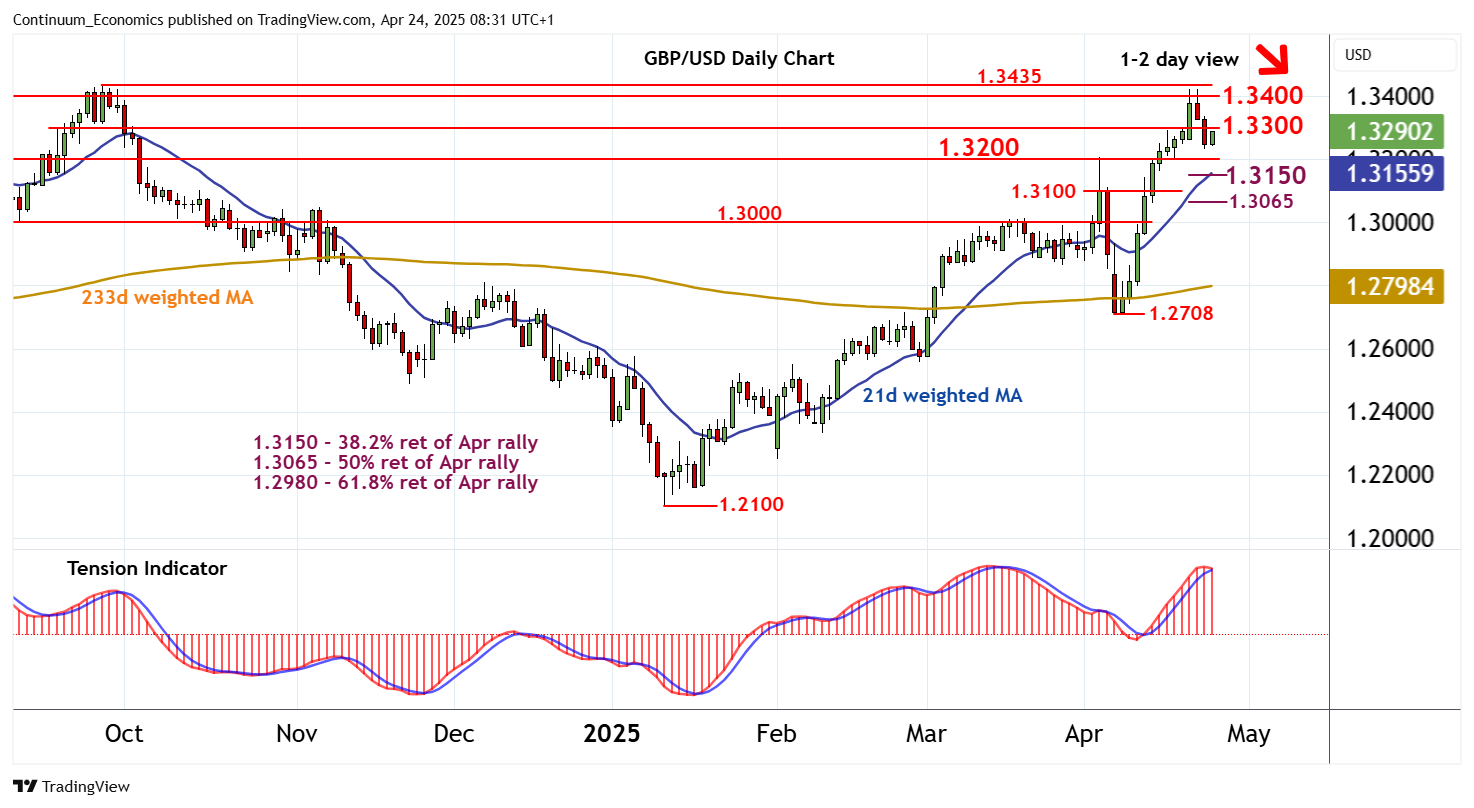
The anticipated break below 1.3300 has reached 1.3235
| Level | Comment | Level | Comment | |||||
|---|---|---|---|---|---|---|---|---|
| R4 | 1.3500 | ** | congestion | S1 | 1.3200 | ** | break level | |
| R3 | 1.3435 | ** | 26 Sep 2024 (y) high | S2 | 1.3150 | ** | 38.2% ret of Apr rally | |
| R2 | 1.3400 | historic congestion | S3 | 1.3100 | minor congestion | |||
| R1 | 1.3300 | range highs | S4 | 1.3065 | ** | 50% ret of Apr rally |
Asterisk denotes strength of level
08:10 BST - The anticipated break below 1.3300 has reached 1.3235, where rising intraday studies are prompting a bounce back to 1.3300. A test above here cannot be ruled out. But negative daily readings are expected to limit scope in renewed buying interest beneath 1.3400. Following cautious/corrective trade, fresh losses are looked for. A break below support at 1.3200 will open up the 1.3150 Fibonacci retracement. However, rising weekly charts are expected to prompt buying interest towards here. A break, if seen, will extend losses initially towards 1.3100.