Published: 2026-03-20T06:30:26.000Z
Chart AUD/NZD Update: Leaning lower in consolidation
1
Lower in consolidation from the 1.2150 high as prices unwind overbought intraday and daily studies
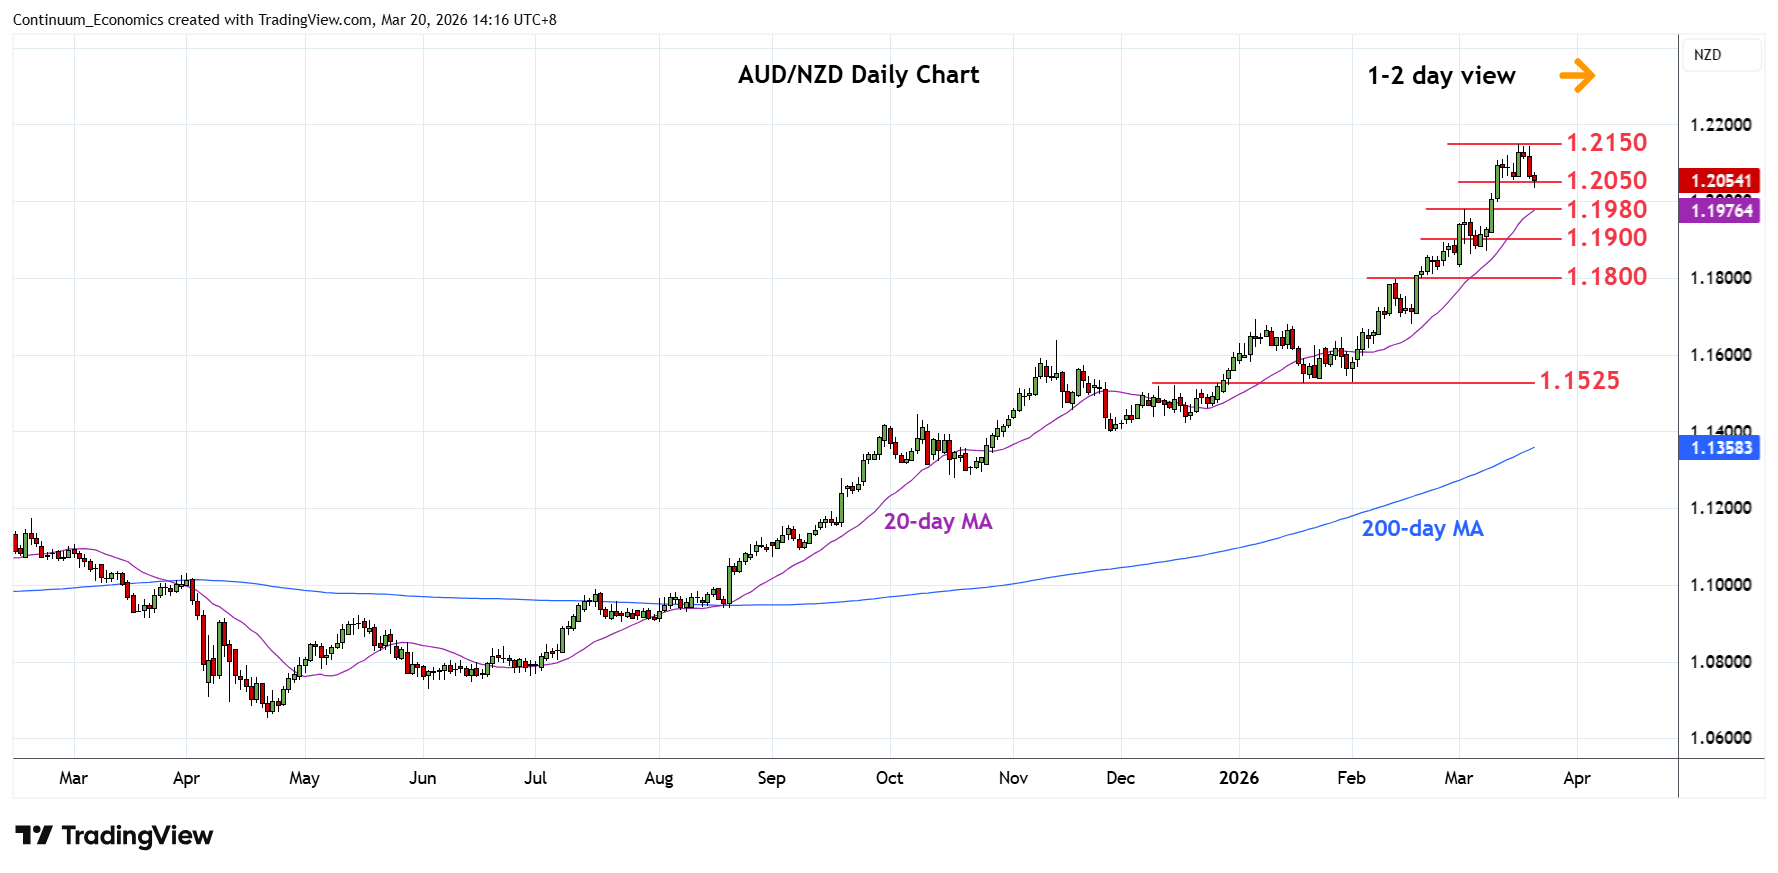
| Level | Comment | Level | Comment | |||||
|---|---|---|---|---|---|---|---|---|
| R4 | 1.2345 | * | 61.8% 2011/2020 fall | S1 | 1.2050 | * | 16 Mar low | |
| R3 | 1.2320 | ** | 2011 year low | S2 | 1.1980 | * | 3 Mar high | |
| R2 | 1.2200 | * | congestion | S3 | 1.1900 | * | congestion | |
| R1 | 1.2150 | ** | 17 Mar YTD high | S4 | 1.1830/00 | ** | 2 Mar low, congestion |
Asterisk denotes strength of level
06:20 GMT - Lower in consolidation from the 1.2150 high as prices unwind overbought intraday and daily studies. Below the 1.2050 support will see room to the 1.2000/1.1980 area and 1.1900 congestion. However, underlying bullish trend suggest corrective pullback expected to give way to renewed buying interest later. Above the 1.2150 high will see room for further gains to retrace losses from the 2011 year high. Higher will see extension to the 1.2200 congestion. Higher still, will turn focus to strong resistance at 1.2320/1.2345, 2011 year low and 61.8% Fibonacci retracement.