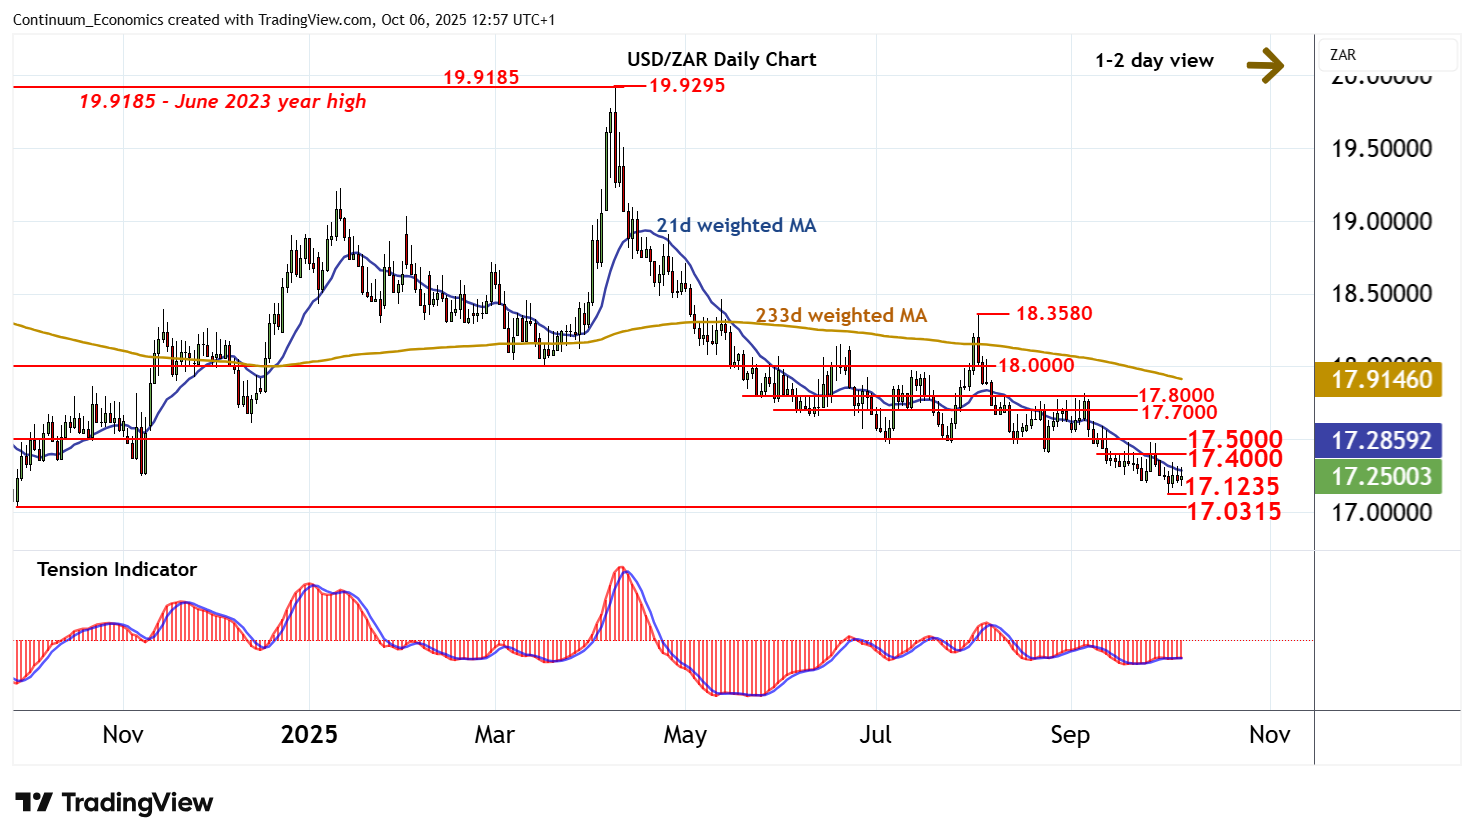
Chart USD/ZAR Update: Balanced above fresh year low
The bounce from the 17.1235 current year low of 1 October is giving way to consolidation
| Level | Comment | Level | Comment | |||||
|---|---|---|---|---|---|---|---|---|
| R4 | 17.8000 | * | congestion | S1 | 17.1235 | ** | 1 Oct YTD low | |
| R3 | 17.7000 | * | congestion | S2 | 17.0315 | ** | 30 Sep 2024 (y) low | |
| R2 | 17.5000 | ** | congestion | S3 | 17.0000 | ** | congestion | |
| R1 | 17.4000 | * | break level | S4 | 16.7370 | ** | July 2023 low |
Asterisk denotes strength of level
12:40 BST - The bounce from the 17.1235 current year low of 1 October is giving way to consolidation, with prices currently trading around 17.2475. Daily readings have turned mixed/positive, highlighting room for a test higher. But mixed weekly charts are expected to limit initial scope in consolidation beneath resistance at the 17.4000 break level. Just higher is congestion around 17.5000. A close above here is needed to improve sentiment and prompt further gains towards congestion within 17.7000-17.8000. Meanwhile, a break below 17.1235 will open up critical support at the 17.0315 year low of 30 September 2024. A close beneath here would turn sentiment outright negative and confirm continuation of May 2023 losses.