Published: 2026-05-11T06:41:33.000Z
Chart AUD/JPY Update: Extend consolidation below 114.00/70 highs
2
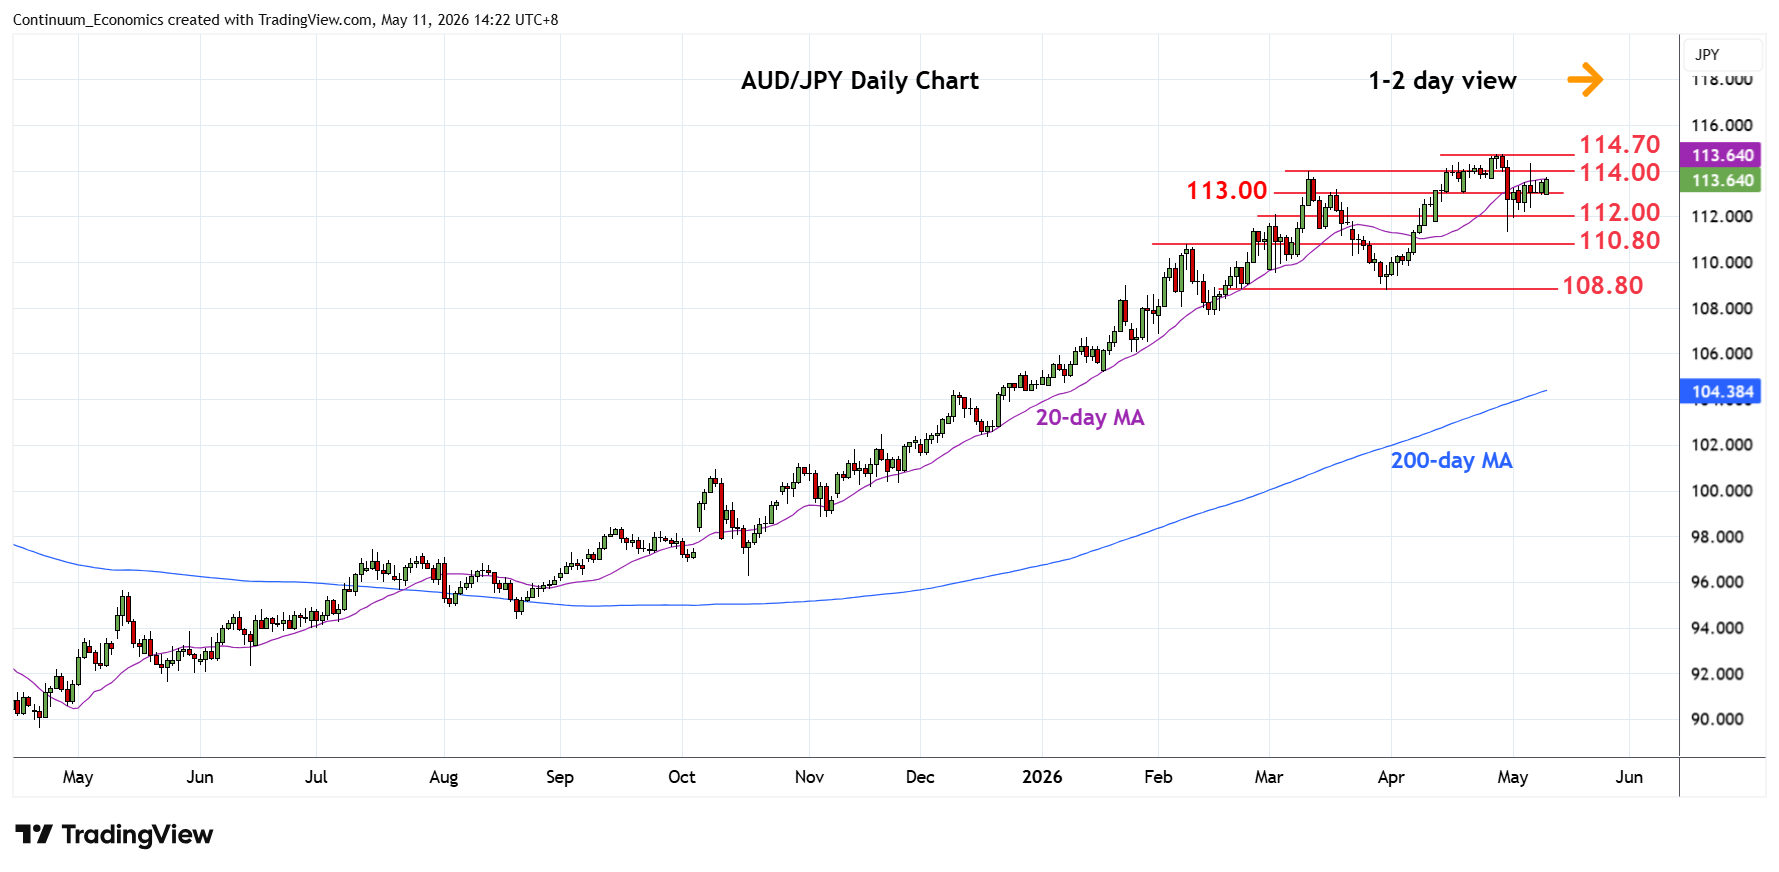
Extend bounce from the 111.30 low of 30 April as prices retrace losses from the 114.70 current year high
| Levels | Imp | Comment | Levels | Imp | Comment | |||
|---|---|---|---|---|---|---|---|---|
| R4 | 116.00 | * | congestion | S1 | 113.00 | * | congestion | |
| R3 | 115.00 | * | congestion | S2 | 112.00 | * | congestion | |
| R2 | 114.70 | ** | 28 Apr YTD high | S3 | 111.30 | ** | 30 Apr low | |
| R1 | 114.00 | * | congestion | S4 | 110.80 | * | 9 Feb high |
Asterisk denotes strength of level
06:35 GMT - Extend bounce from the 111.30 low of 30 April as prices retrace losses from the 114.70 current year high. Choppy gains see the 114.00/114.70 highs expected to cap gains and give way to renewed selling pressure later. Would take break of support at the 112.00 congestion and 111.30 low to open up room for deeper pullback to support at the 110.80/110.00 area. Break here will expose the 108.80 March low to retest. Meanwhile, break above the 114.00/70 highs, if seen, will extend the underlying bull trend from the April 2025 year low.