Published: 2026-03-24T13:34:01.000Z
Chart USD/RUB Update: Sharp fall from fresh year highs
1
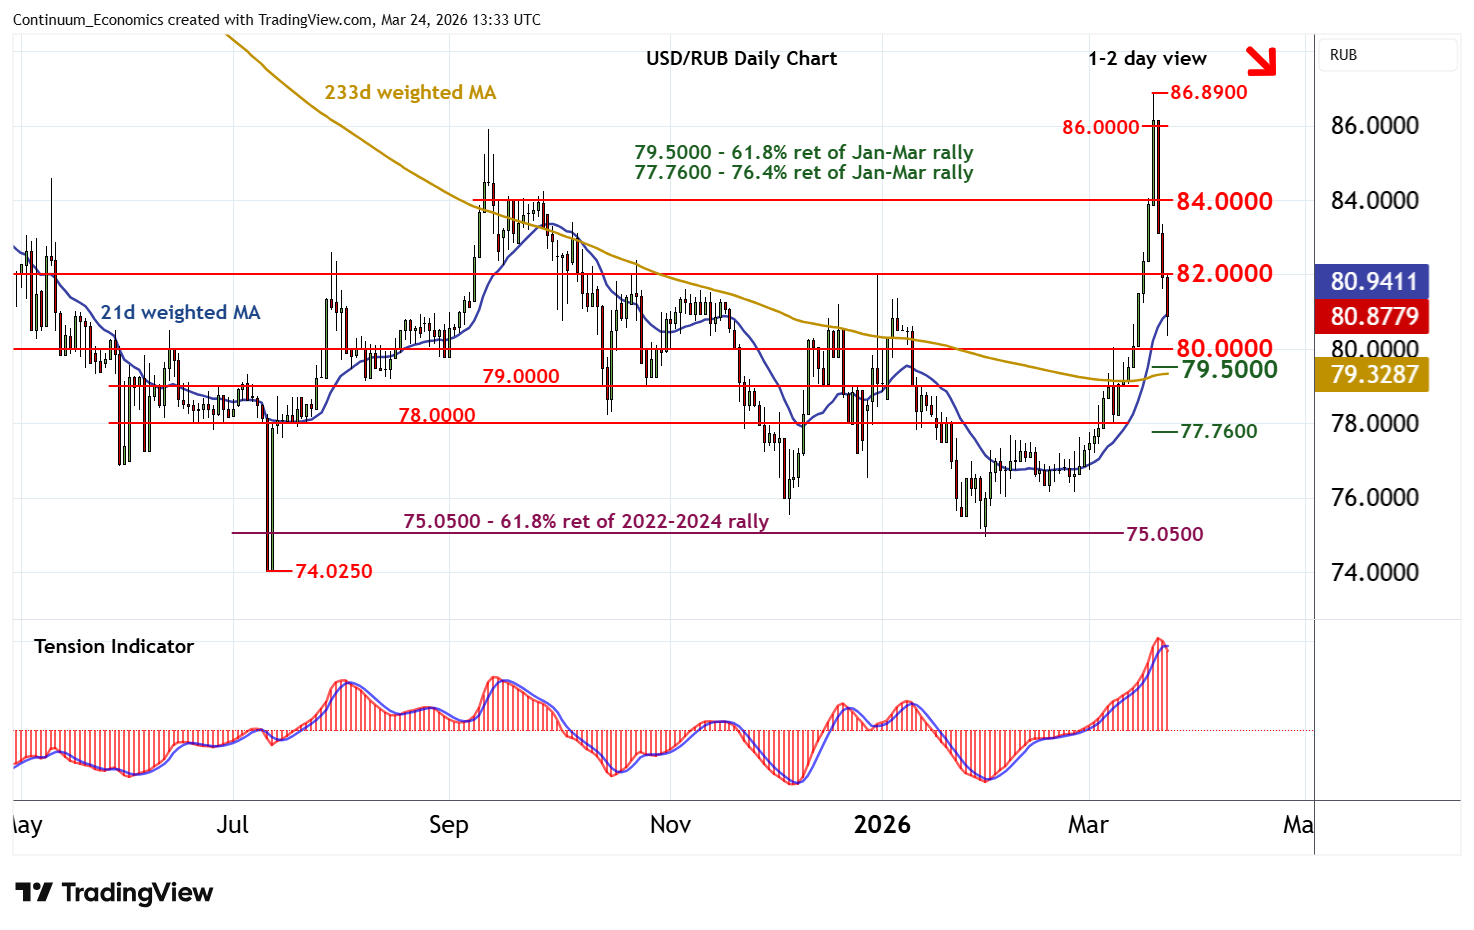
The anticipated continuation of January gains has accelerated
| Levels | Comment | Levels | Comment | |||||
| R4 | 86.8900 | ** | 19 Mar YTD high | S1 | 80.0000 | ** | break level | |
| R3 | 86.0000 | * | congestion | S2 | 79.5000 | ** | 61.8% ret of Jan-Mar rally | |
| R2 | 84.0000 | * | congestion | S3 | 79.0000 | * | break level | |
| R1 | 82.0000 | ** | congestion | S4 | 78.0000 | * | break level |
Asterisk denotes strength of level
12:55 GMT - The anticipated continuation of January gains has accelerated, with prices posting a break year high at 86.8900 before falling sharply to trade around 80.8800. Daily readings have turned down and overbought weekly stochastics are also under pressure, highlighting room for further losses towards the 80.0000 break level. Just lower is the 79.5000 Fibonacci retracement. But already oversold daily stochastics are expected to limit any initial tests of this range in consolidation. Meanwhile, resistance is at congestion around 82.0000. A close above here, if seen, should give way to consolidation beneath further congestion around 84.0000.