Published: 2026-04-10T13:47:39.000Z
Chart AUD/USD Update: Pushing higher
-
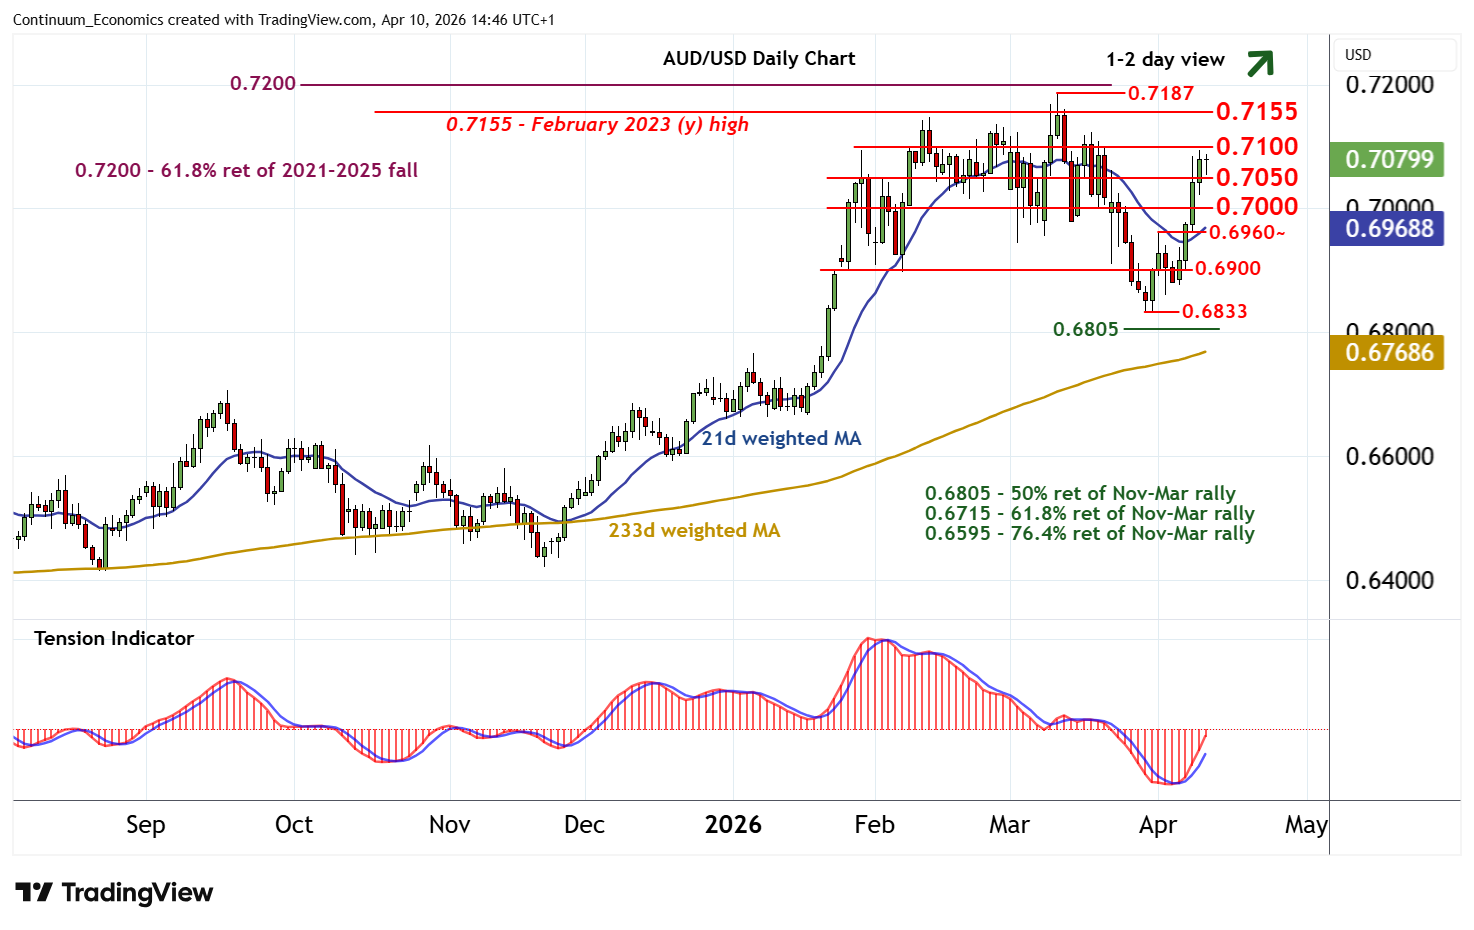
The anticipated break above 0.7050 has been pushed back from just below congestion resistance at 0.7100
| Levels | Imp | Comment | Levels | Imp | Comment | |||
|---|---|---|---|---|---|---|---|---|
| R4 | 0.7200 | ** | 61.8% ret of 2021-2025 fall | S1 | 0.7050 | * | congestion | |
| R3 | 0.7187 | ** | 11 Mar YTD high | S2 | 0.7000 | * | congestion | |
| R2 | 0.7155 | * | February 2023 (y) high | S3 | 0.6960 | * | 1 Apr (w) high | |
| R1 | 0.7100 | congestion | S4 | 0.6900 | * | break level |
Asterisk denotes strength of level
14:35 BST - The anticipated break above 0.7050 has been pushed back from just below congestion resistance at 0.7100, with prices currently balanced within the 0.7050 - 0.7100 range. Daily readings continue to rise, highlighting room for a test above 0.7100. But negative weekly charts should limit scope in profit-taking/consolidation beneath critical resistance within the 0.7155 - 0.7187 range. Meanwhile, a close back below congestion support at 0.7050 would turn sentiment cautious and prompt consolidation above further congestion around 0.7000.