Published: 2025-09-12T06:55:46.000Z
Chart USD/IDR Updates: Lower from 16490/16495 highs
0
-
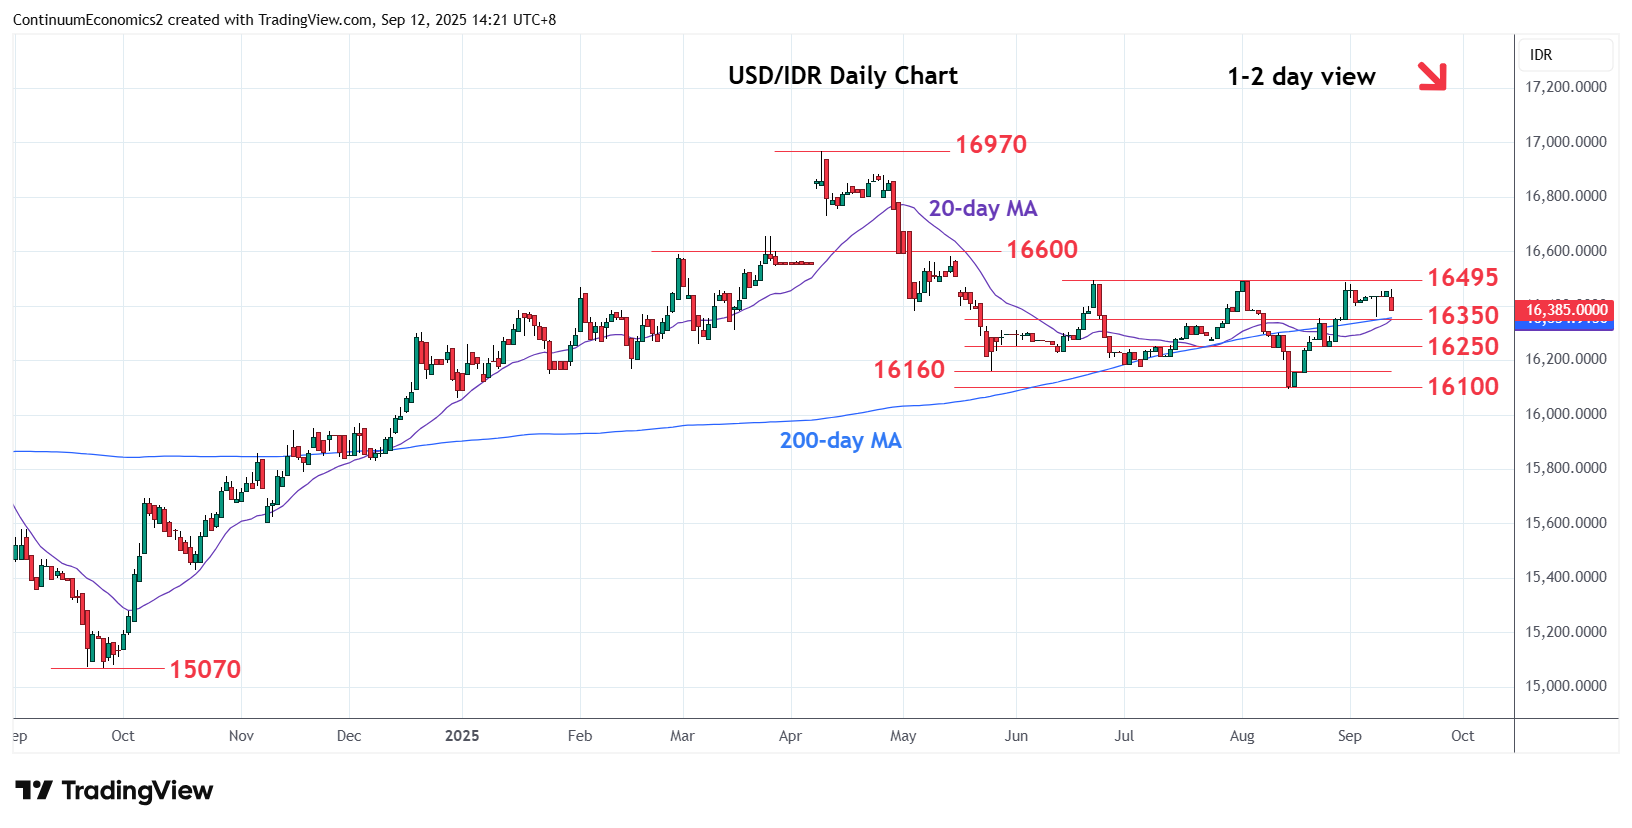
Settled back from approach of resistance at the 16490/16495, August/June highs, as prices unwind the overbought daily studies
| Levels | Imp | Comment | Levels | Imp | Comment | |||
|---|---|---|---|---|---|---|---|---|
| R4 | 16730 | ** | 10 Apr low | S1 | 16400 | * | 2 Sep low | |
| R3 | 16635 | * | 61.8% Apr/Aug fall | S2 | 16350 | * | congestion | |
| R2 | 16585 | * | 14 May high | S3 | 16250 | * | 25 Aug low | |
| R1 | 16490/95 | ** | 1 Aug, Jun highs | S4 | 16160 | * | May low, congestion |
Asterisk denotes strength of level
06:50 GMT - Settled back from approach of resistance at the 16490/16495, August/June highs, as prices unwind the overbought daily studies. Below the 16400 support will open up room for deeper pullback to the 16350/16250 area. Would take break here to return focus to the downside and open up room for retest of the 16160 and 16100 lows. Break of the latter will see deeper pullback to retrace the September/April gains to the 16000 figure. Meanwhile, resistance at the 16490/16495 highs are expected to cap.