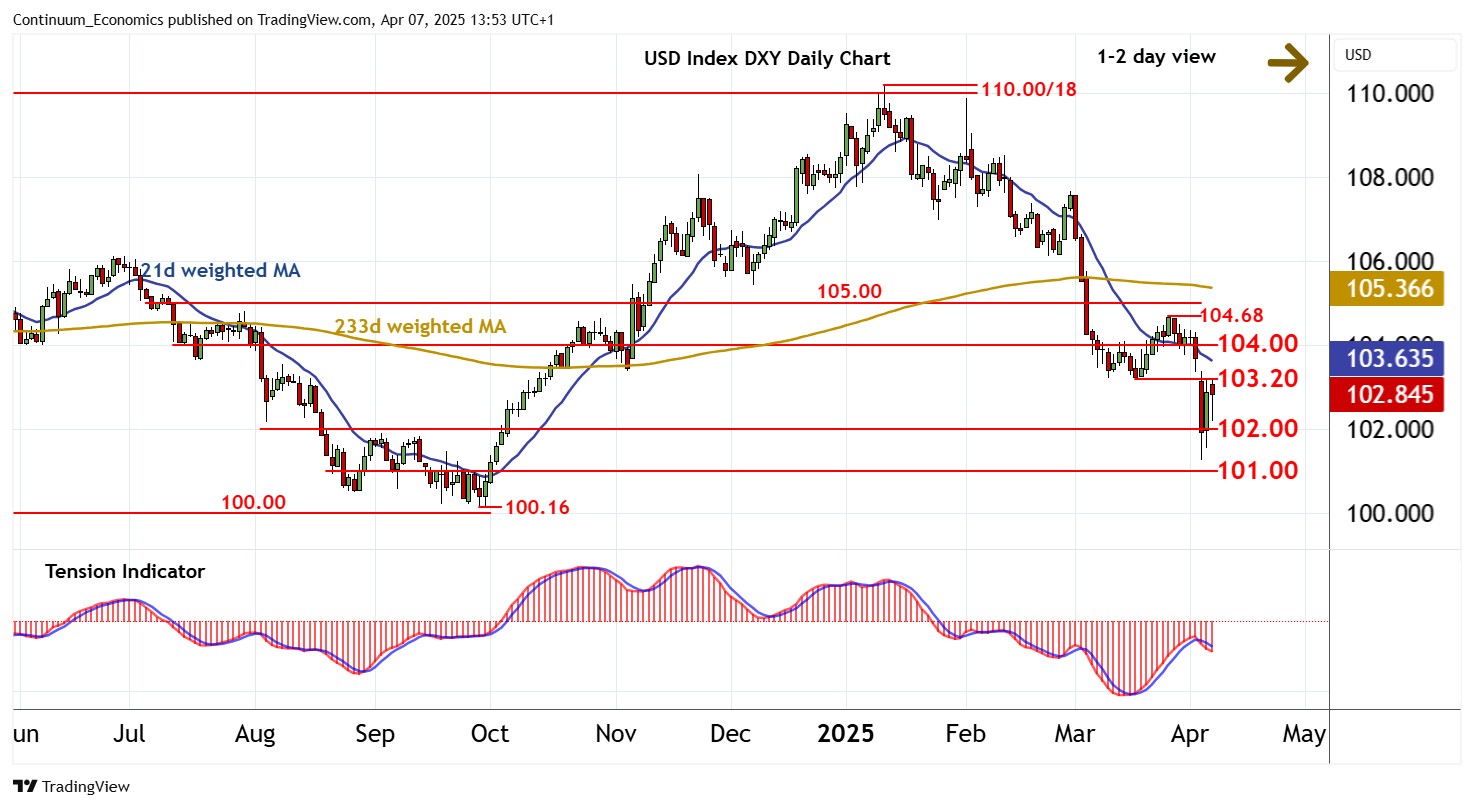
Chart USD Index DXY Update: Consolidating sharp losses - any gains to remain limited

Little change, as prices extend choppy trade beneath resistance at the 103.20 monthly low of 18 March
| Levels | Imp | Comment | Levels | Imp | Comment | |||
|---|---|---|---|---|---|---|---|---|
| R4 | 105.00 | break level | S1 | 102.00 | ** | break level | ||
| R3 | 104.68 | * | 26 Mar (w) high | S2 | 101.25~ | 3 Apr YTD low | ||
| R2 | 104.00 | * | congestion | S3 | 101.00 | * | congestion | |
| R1 | 103.20 | ** | 18 Mar (m) low | S4 | 100.16 | ** | 27 Sep 2024 (y) low |
Asterisk denotes strength of level
13:45 BST - Little change, as prices extend choppy trade beneath resistance at the 103.20 monthly low of 18 March. Intraday studies are mixed/positive and negative daily stochastics are flattening, suggesting a minor improvement in sentiment and room for a test higher in the coming sessions. However, the bearish daily Tension Indicator and negative weekly charts are expected to limit any tests above 103.20 in renewed selling interest beneath congestion around 104.00. Meanwhile, support remains at 102.00. A later break beneath here will open up 101.00, with room for continuation down to strong support at the 100.16 year low of 27 September 2024.