Published: 2024-12-19T08:16:16.000Z
Chart GBP/USD Update: Choppy trade leaning lower

Senior Technical Strategist
-

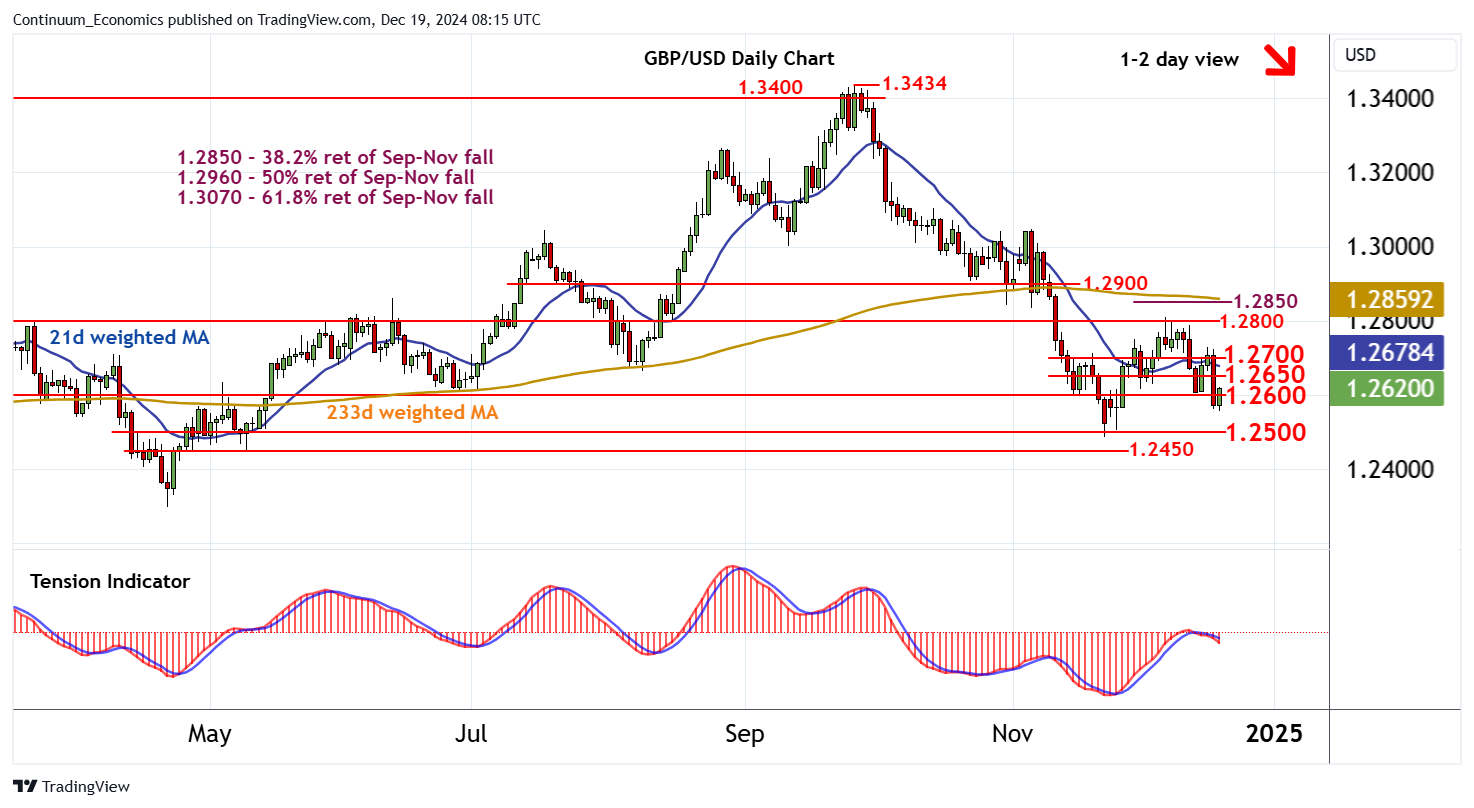
Anticipated losses have extended below 1.2600

| Level | Comment | Level | Comment | |||||
|---|---|---|---|---|---|---|---|---|
| R4 | 1.2850 | * | 38.2% ret of Sep-Nov fall | S1 | 1.2600 | * | congestion | |
| R3 | 1.2800 | ** | break level | S2 | 1.2555 | intraday low | ||
| R2 | 1.2700 | break level | S3 | 1.2500 | * | congestion | ||
| R1 | 1.2650 | minor congestion | S4 | 1.2450 | * | congestion |
Asterisk denotes strength of level
08:05 GMT - Anticipated losses have extended below 1.2600, with prices meeting support at 1.2555 and bouncing back above 1.2600. Oversold intraday studies are unwinding, suggesting potential for a minor test higher. But daily readings have turned down and weekly charts are under pressure, highlighting difficulty sustaining any tests above 1.2650. Following cautious trade, fresh losses are looked for. A later break back below congestion support at 1.2600 will open up further congestion around 1.2500. However, by-then oversold daily stochastics could limit any initial tests in short-covering/consolidation.