Published: 2026-03-23T08:56:40.000Z
Chart USD Index DXY Update: Gains to remain limited
-
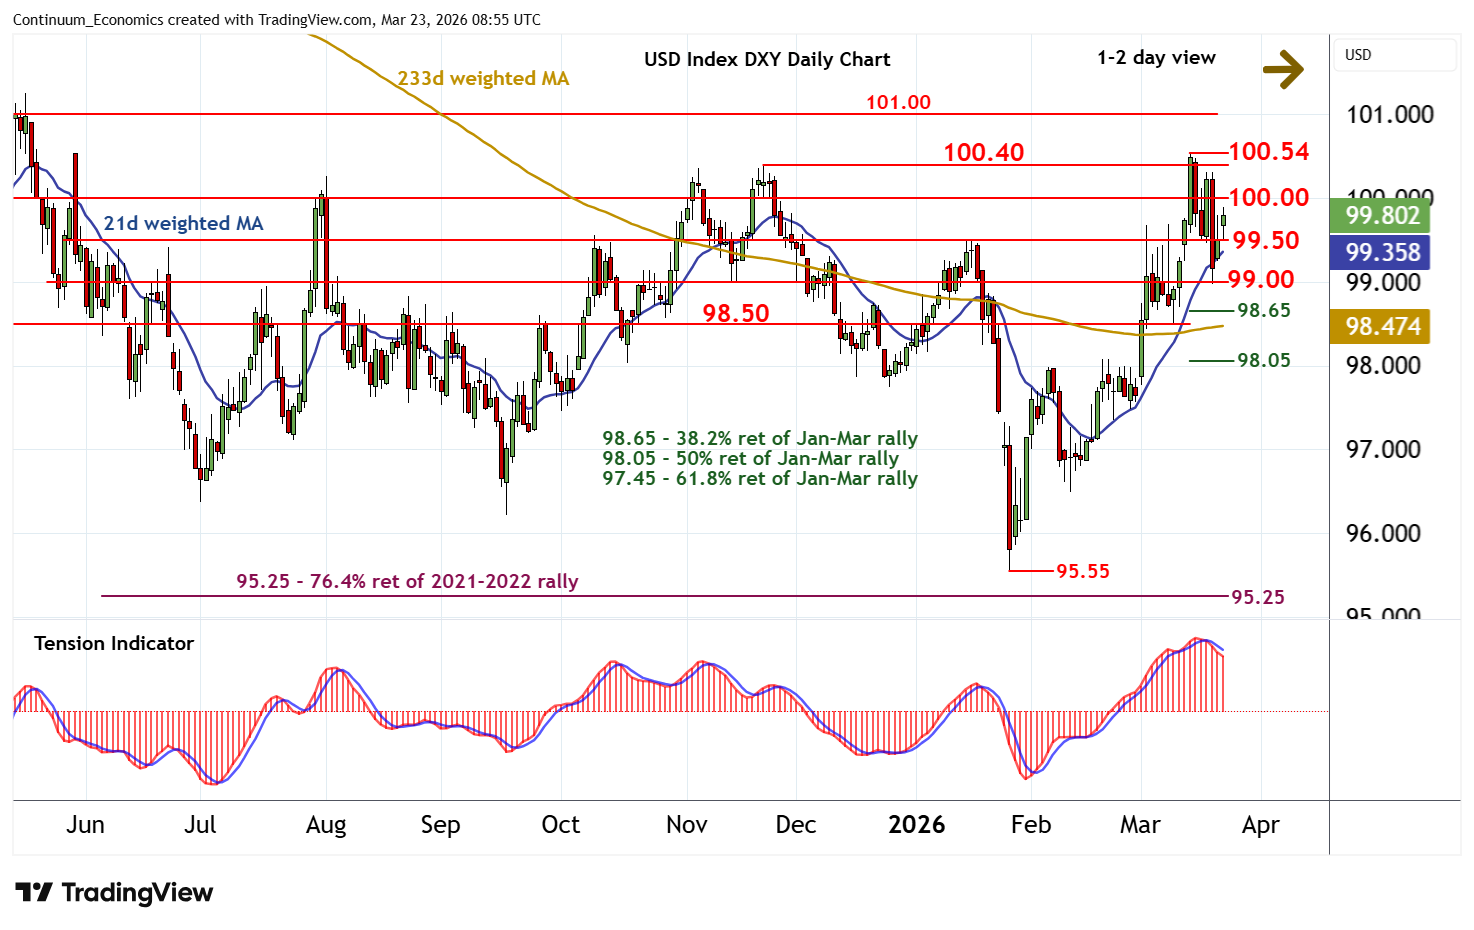
Consolidation within the 99.00 - 99.50 range is giving way to a drift higher
| Levels | Imp | Comment | Levels | Imp | Comment | |||
|---|---|---|---|---|---|---|---|---|
| R4 | 101.15 | ** | 38.2% ret of 2025-2026 fall | S1 | 99.50 | * | congestion | |
| R3 | 101.00 | * | congestion | S2 | 99.00 | ** | congestion | |
| R2 | 100.40/54 | ** | 21 Nov (m); 13 Mar YTD highs | S3 | 98.65 | * | 38.2% ret of Jan-Mar rally | |
| R1 | 100.00 | ** | congestion | S4 | 98.50 | * | congestion |
Asterisk denotes strength of level
08:50 GMT - Consolidation within the 99.00 - 99.50 range is giving way to a drift higher, as intraday studies tick up, with prices currently trading around 99.75. Focus is back on congestion resistance at 100.00. But negative daily readings should limit any immediate break in consolidation beneath critical resistance at the 100.40 monthly high of 21 November and the 100.54 current year high of 13 March. Meanwhile, support is raised to congestion around 99.50. But a close below further congestion around 99.00 is needed to turn sentiment negative and open up a test of the 98.65 Fibonacci retracement.