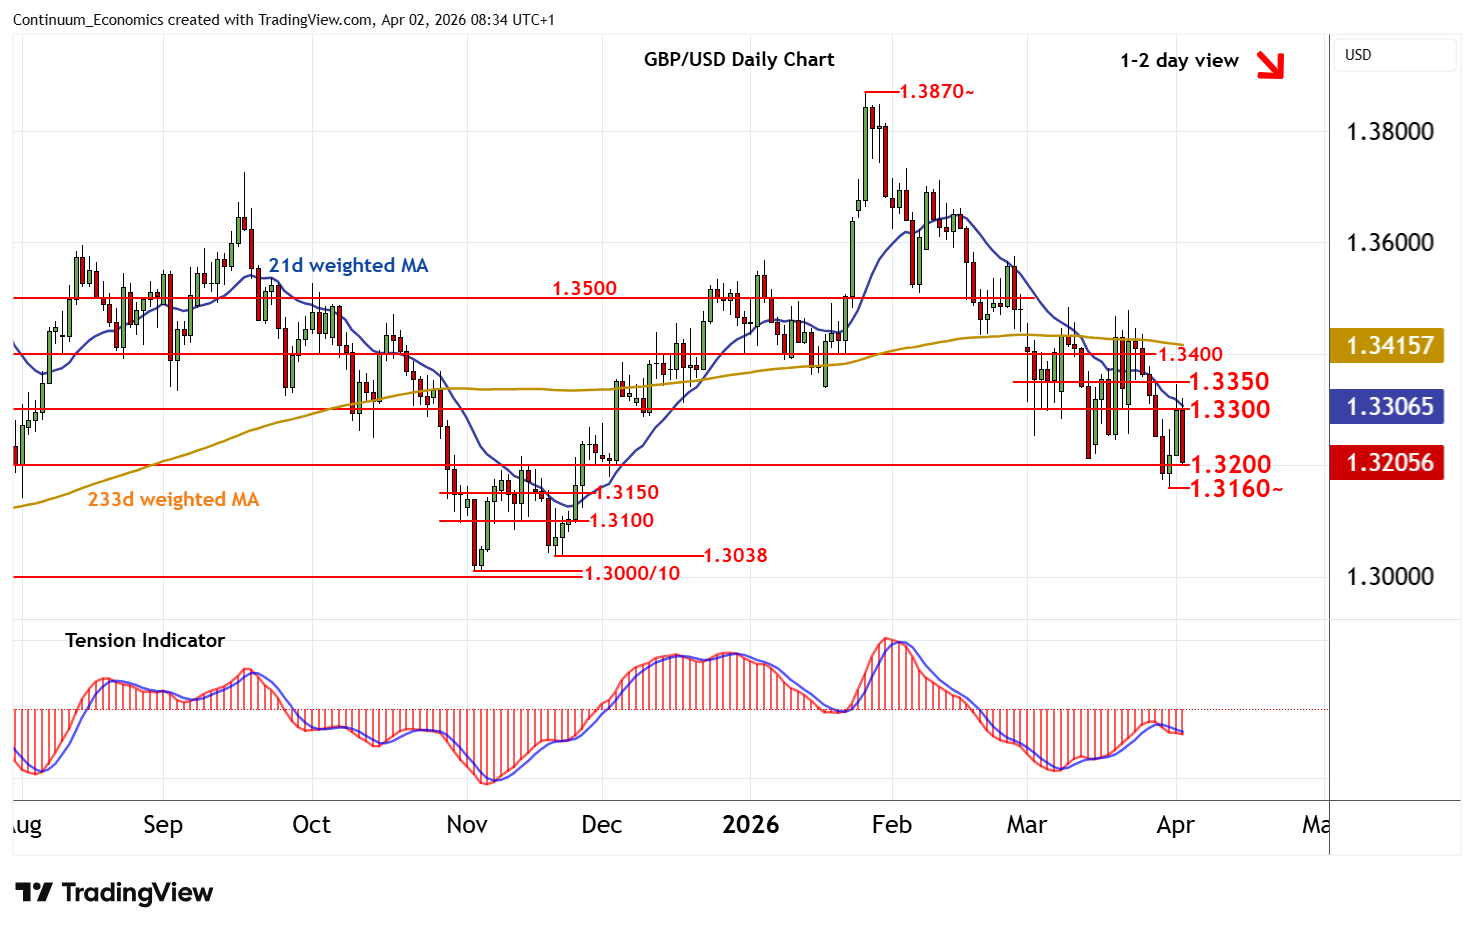
Chart GBP/USD Update: Lower in choppy trade
The anticipated break above 1.3300 has been pushed back from 1.3350 in rising volatility
| Level | Comment | Level | Comment | |||||
|---|---|---|---|---|---|---|---|---|
| R4 | 1.3500 | ** | congestion | S1 | 1.3200 | * | congestion | |
| R3 | 1.3400 | ** | congestion | S2 | 1.3160~ | * | 31 Mar YTD low | |
| R2 | 1.3350 | congestion | S3 | 1.3150 | * | congestion | ||
| R1 | 1.3300 | * | congestion | S4 | 1.3100 | * | congestion |
Asterisk denotes strength of level
08:10 BST - The anticipated break above 1.3300 has been pushed back from 1.3350 in rising volatility, as intraday studies turn down, with prices currently balanced above congestion support at 1.3200. Daily readings are coming under fresh pressure and broader weekly charts are mixed/negative, highlighting room for further losses in the coming sessions. A break below 1.3200 will open up strong support at the 1.3160~ current year low of 31 March. A further close beneath here will add weight to sentiment and extend January losses into congestion within the 1.3100 - 1.3150 range. Meanwhile, resistance is up to congestion around 1.3300 and should cap any immediate tests higher. A close above here, if seen, will stabilise price action and prompt consolidation beneath 1.3350.