Published: 2026-04-09T01:05:55.000Z
Chart USD/JPY Update: Consolidating test of 158.00 level
2
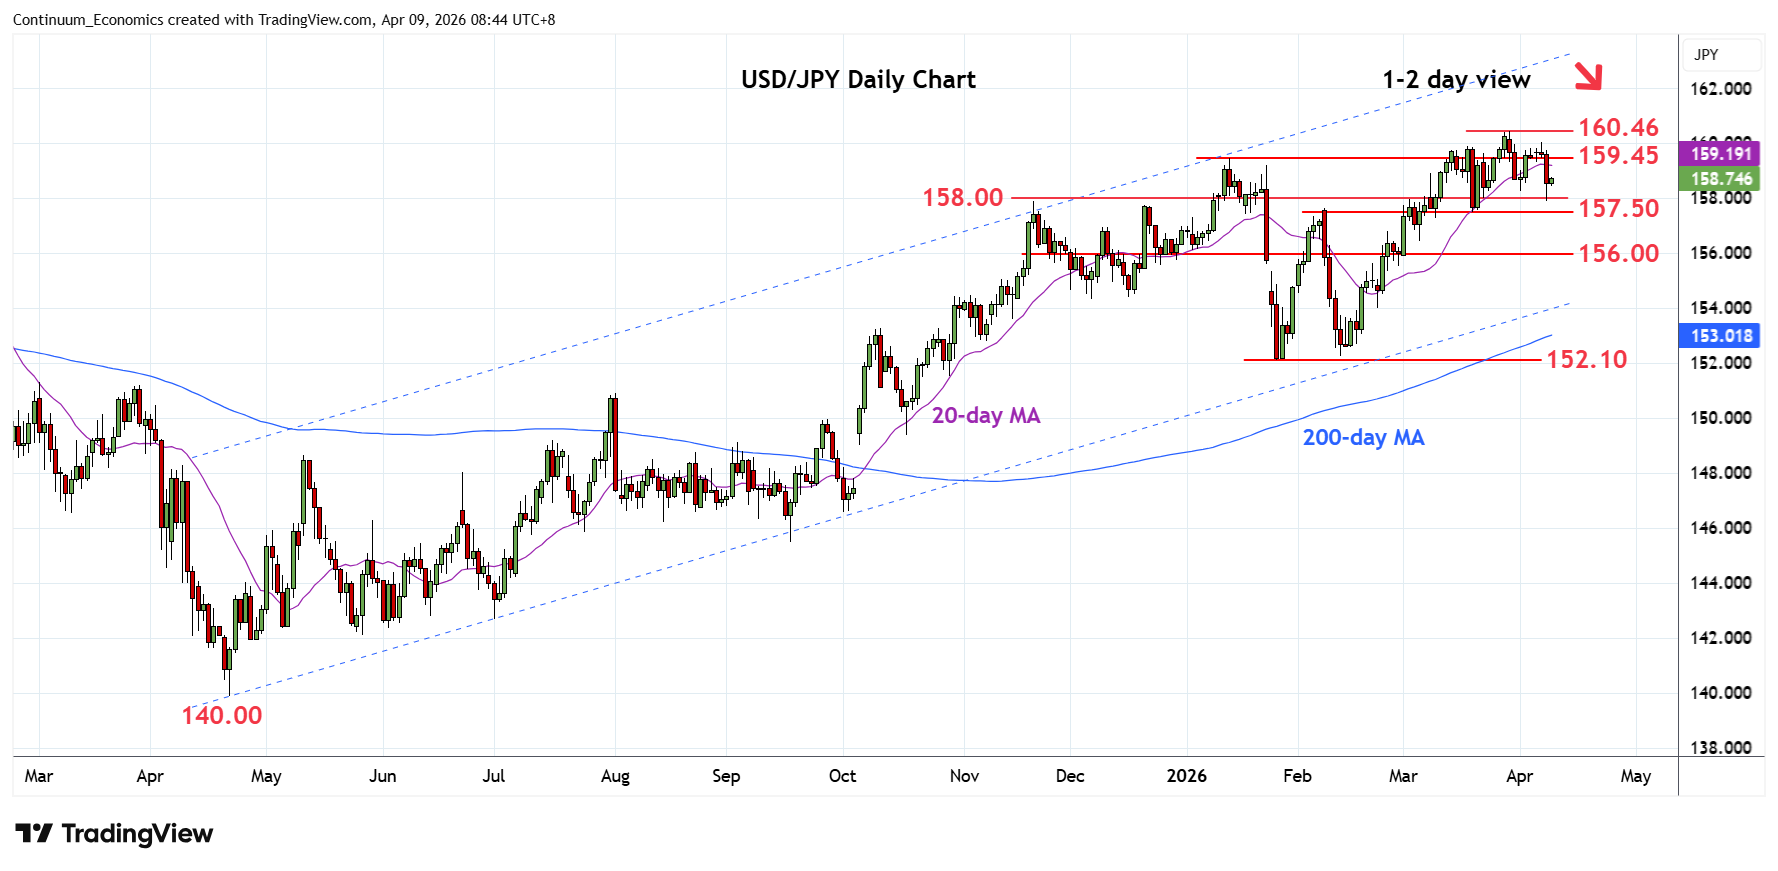
Turned up from test of the 158.27/00 support as prices consolidate rejection from the 160.00 high
| Levels | Imp | Comment | Levels | Imp | Comment | |||
|---|---|---|---|---|---|---|---|---|
| R4 | 160.46 | ** | 30 Mar YTD high | S1 | 158.27/00 | ** | 1 Apr low, congestion | |
| R3 | 160.00 | * | congestion | S2 | 157.50 | ** | 19 Mar low | |
| R2 | 159.45 | * | Jan high | S3 | 157.25 | * | 38.2% Jan/Mar rally | |
| R1 | 159.00 | congestion | S4 | 156.50 | * | congestion |
Asterisk denotes strength of level
00:50 GMT - Turned up from test of the 158.27/00 support as prices consolidate rejection from the 160.00 high and unwind oversold intraday studies. However, the negative daily and weekly studies suggest this giving way to renewed selling pressure later. Lower will see deeper pullback to retrace gains from the 152.10 January current year low and see room to the 157.50 support. Break here will confirm a top in place at the 160.46 high. Meanwhile, resistance is at the 159.00/159.45 congestion and January high which is expected to cap.