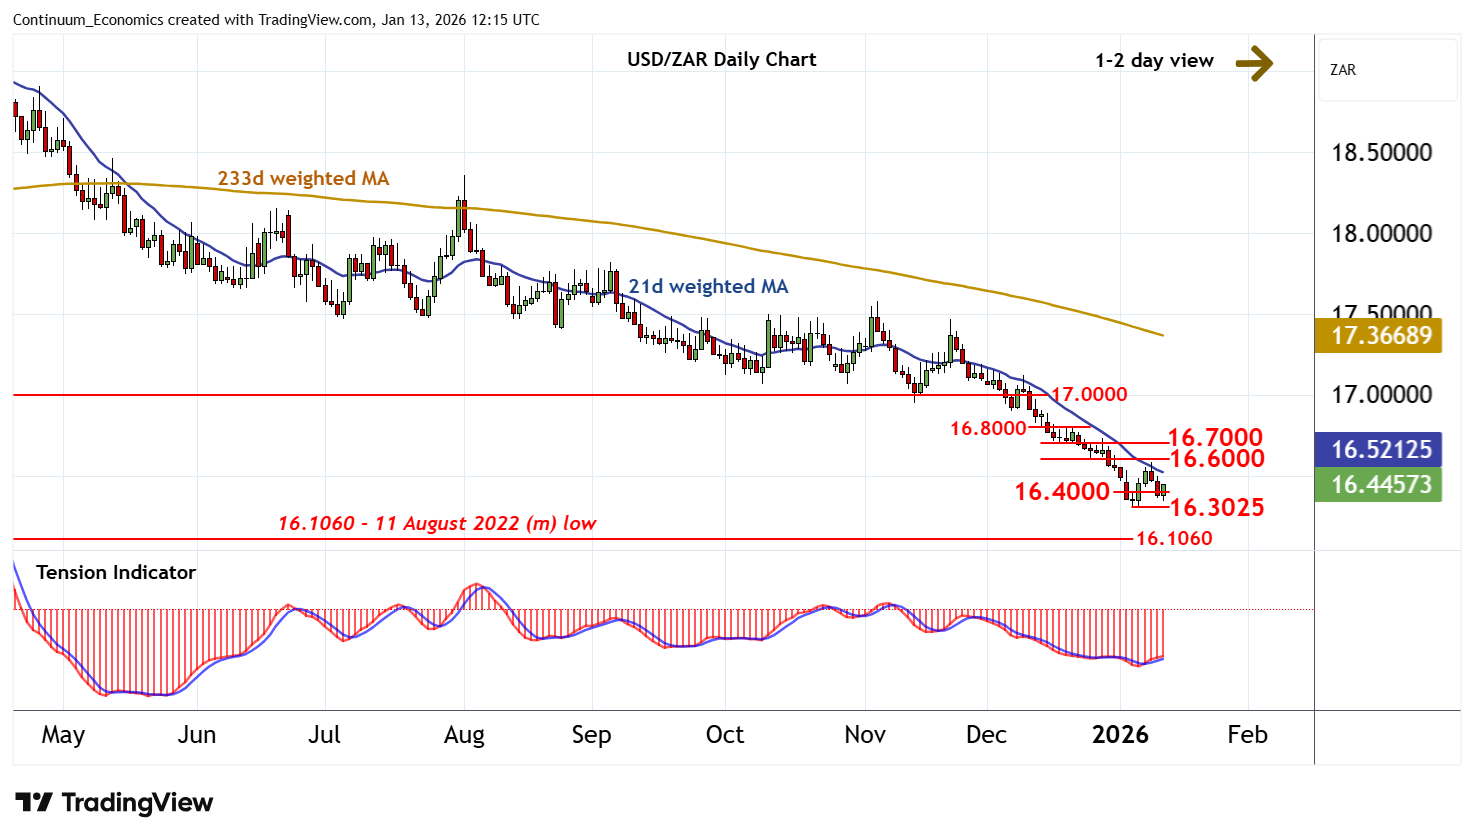
Chart USD/ZAR Update: Choppy above support
The anticipated break below 16.4000 has bounced from above strong support at the 16.3025 current year low of 6 January
| Level | Comment | Level | Comment | |||||
|---|---|---|---|---|---|---|---|---|
| R4 | 17.0000 | ** | congestion | S1 | 16.4000 | break level | ||
| R3 | 16.8000 | break level | S2 | 16.3025 | * | 6 Jan YTD low | ||
| R2 | 16.7000 | break level | S3 | 16.1060 | ** | 11 Aug 2022 (m) low | ||
| R1 | 16.6000 | break level | S4 | 16.0000 | ** | congestion |
Asterisk denotes strength of level
12:15 GMT - The anticipated break below 16.4000 has bounced from above strong support at the 16.3025 current year low of 6 January, as oversold intraday studies unwind, with prices once again trading above 16.4000. The daily Tension Indicator is rising, suggesting room for further gains. But a tick lower in overbought daily stochastics and negative weekly charts are expected to limit scope in renewed selling interest beneath resistance at the 16.6000 break level. Following cautious trade, fresh losses are looked for. However, a close below 16.3025 is needed to add weight to sentiment and extend the April bear trend towards the 16.1060 monthly low of 11 August 2022 and historic congestion around 16.0000. Just lower is the 15.8800 Fibonacci retracement. But flat oversold weekly stochastics are expected to limit any initial tests of this broad 15.8800 - 16.1060 range in short-covering/consolidation.